Using geospatial technologies to understand dryland dynamics
![]() No.
51, May/June 2002
No.
51, May/June 2002
Using geospatial technologies to understand dryland
dynamics
| A. Mean monthly AI Values for N7-TOMS (1980-1992) | 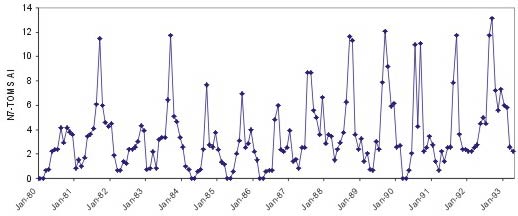 |
| B. Mean monthly values for EP-TOMS (1996-2000) | 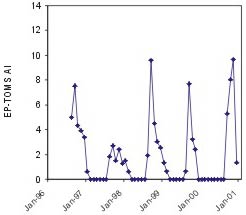 |
| C. Monthly averages of AI for both N7-TOMS and EP-TOMS data | 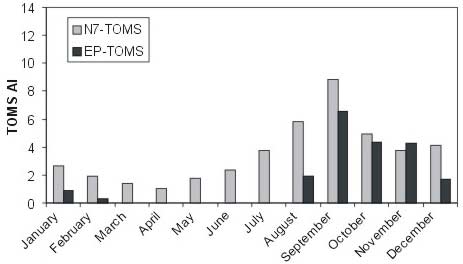 |