Using geospatial technologies to develop
participatory tools for natural resources management
![]() No. 53, May/June 2003
No. 53, May/June 2003
Using geospatial technologies to develop
participatory tools for natural resources management
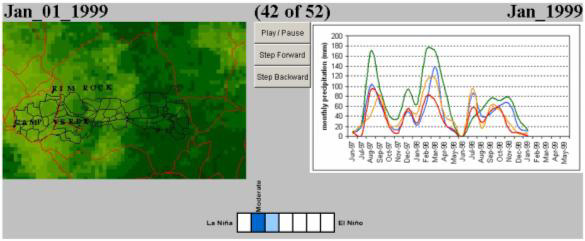
An example image displaying precipitation data (right) from rain gauges near the V-V Ranch in northern Arizona alongside biweekly NDVI images (left). In this example, there are four rain gauges with monthly data from June 1997 through May 1999, with corresponding images composited every two weeks for the same period. |