Using geospatial technologies to develop
participatory tools for natural resources management
![]() No.
53, May/June 2003
No.
53, May/June 2003
Using geospatial technologies to develop
participatory tools for natural resources management
by Jerry Stuth, Jay Angerer, Robert Kaitho, Kristen Zander, Abdi Jama, Clint Heath, Jim Bucher, Wayne Hamilton, Richard Conner, and David Inbody
| "The LEWS technology package has demonstrated that satellite weather and NDVI data can be incorporated into an analytical system to simulate forage conditions over large regions, map those conditions, and forecast likely responses." |
Introduction(Back to top) Over the past 10 years, the Ranching Systems Group (RSG) within the Center for Natural Resource Information Technology (CNRIT) and the Center for Grazinglands and Ranch Management (CGRM) at Texas A&M University have been working on a new suite of technologies that help mitigate the risk of drought and improve adoption rates of the information that is released. The overall technology described herein was initially funded in 1997 by the United States Agency for International Development (USAID) Global Livestock Collaborative Research Support Program (GLCRSP) administered by the University of California-Davis for development of a Livestock Early Warning System (LEWS) in East Africa. The technology has subsequently been configured for use in the United States as part of a LEWS pilot program in Texas and has served as the basis for design of a new National Range and Forage Loss Insurance program administered by USDA-Risk Management Agency. This paper describes how the LEWS technology works and the emerging issues associated with adoption of information generated for improving the stocking decision making process. Cross comparisons between the system being implemented for the US ranching industry and technology implemented for East African pastoralists will be highlighted. Pastoralists in Africa are facing conditions where traditional drought-coping norms are collapsing due to increased population pressure, erratic climatic patterns with higher frequency of drought, limited marketing opportunities, changing land tenure patterns, rising social conflict, limited water supply and greater incidences of disease transmission. In the US, the ranching industry is facing a major change in land ownership patterns and a shifting experience base of managers where "norms of production" are not well established. Profit margins are very low, resulting in a greater focus on risk management tools to mitigate the impact of unexpected events on survival of the ranch firm. LEWS technology, information and analysis design(Back to top) Throughout the development of the LEWS technology, we have attempted to determine what kind of information would be valued by livestock producers. Surveys of ranchers in Texas and pastoral communities in Ethiopia, Kenya, Tanzania and Uganda all revealed the same trend for information needs. Essentially, to support decisions on destocking/restocking or moving to other grazing areas, there needs to be an indication of how the plants translate weather into forage and a quantification of how current conditions deviate from historical average responses. Additional information on what forage conditions were like at the same time last year and a few years back, coupled with trend information and a near-term forecast (preferably 90 days ahead), were also deemed important for improved decisions. Finally, all decision-makers indicated that analyses must be believable, requiring a period where they can ground-truth the information provided on forage conditions. This process builds their confidence in using the information for decision-making (Jochec et al. 2001). |
|
|
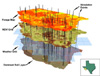
Given the variety of decision environments and governmental support infrastructures that were to be serviced by LEWS, our research team needed to design an automated system to acquire on-line weather data, run the forage production simulation model, and then package the output into a series of products delivered to a wide variety of information users. To overcome these design constraints, a central high-speed server at CNRIT was linked with a series of inexpensive computers using load management software to allow a large number of simulations to be run on a frequent basis. The central server was then linked with the Internet and the model output configured as tables, graphs and maps for near real-time access. In East Africa, we transmitted data to institutions and non-governmental organizations (NGOs) by using new, satellite radio technology; this involved transferring subsets of the data provided on the Internet to a computer server up link site managed by the African Learning Channel in South Africa for broadcasting over the WorldSpace satellite radio system. People on the ground could then link their computers to the satellite radios at a pre-scheduled time and download the LEWS information in approximately 15 minutes, at least three times a week. The information transmitted could be viewed with a standard web browser and/or printed for distribution to key communication nodes in the African LEWS region. Establishing foundation weather data(Back to top) Establishing vegetation monitoring sites(Back to top) The weather, plants, soils and grazing rules data are input into a plant growth simulation model called the Phytomass Growth Model (PHYGROW) to generate forage responses for each unique combination. PHYGROW is a hydrologic-based model capable of calculating forage response and hydrologic process of complex plant communities grazed by multiple animal populations. Before PHYGROW simulations can be completed, each plant species must be assigned a series of growth attributes, such as radiation use efficiency, maximum leaf area index, growth temperatures (minimum, optimum and suppression), green and dead biomass turnover rates, and water adhesion coefficients. This password-protected database stores all the LEWS project information on plants, weather, soils, and grazers. PHYGROW data is accessible to our collaborators via the Internet to allow work within the projects or to create new LEWS projects. |
|
|
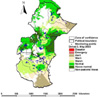
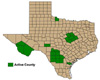
Currently, over 300 monitoring sites across East Africa rangelands are set up for forage production estimation by PHYGROW. These sites are strategically placed to allow limited "sampling" of forage dynamics through use of the biophysical model. Sites are then linked to spatially rich satellite imagery using geostatistical techniques to map regional responses. In the USA, we use the concept of "virtual landscapes" represented inside the 25 x 25 km weather grids. A virtual landscape can be described as a representative plant community and soil combination that is dominant in a weather grid. In the Texas LEWS, there are currently over two hundred 25 x 25 km weather grids established in seven pilot regions of the state, with each grid averaging five different virtual landscapes. The simulations can be set up to allow the user to select a particular plant community or a weighted response given the composition of plant communities in the grid. Forage deviation indexing(Back to top) Using geostatistics to map forage conditions |
|
|
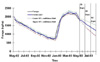
(Back to top) Forecasting 90-day forage conditions |
|
|
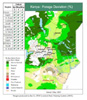
(Back to top) The LEWS technology in Texas is being tested with the new MODIS multiple-scale NDVI imagery to determine the suitability of the 250-m, 500-m and 1000-m data for use in early warning systems via the co-kriging technology developed in Africa. Early work in South Texas has indicated that the 1000-m NDVI data provides reliable forecast values for a variety of forage types when used in the ARIMA model (Al Hamad 2002). We are currently testing the use of the MODIS data in the desert grasslands and mountains of the Trans-Pecos region of West Texas. Linking LEWS with decision makers(Back to top) In the Texas LEWS system, our primary communication outlet is the Internet coupled with weekly releases for local newspapers. The outputs from the system are currently being organized by logical geographic areas and designed so that local daily or weekly newspapers can easily download and publish the maps and text. The approach is not unlike that used for The National Drought Mitigation Center's "Drought Monitor," issued over the Internet (Svoboda et al. 2002). Regional training is also provided for State Extension personnel, US Department of Agriculture personnel in the Natural Resource Conservation Service, and interested ranchers. Training sessions are currently limited to 1-2 hours and focus on accessing the Internet, interpreting information, and using the online tutorials. RSG has also acquired experience in online training systems through its development of the web-based Livestock Nutritional Advisory System, designed to complement the information provided by Texas LEWS. This system allows livestock producers to send in feces samples from their animals and enter herd data. Once a sample is received by our laboratory, it is scanned using near-infrared reflectance spectroscopy (Lyons and Stuth 1992) and livestock diet protein and digestibility estimates are made. These are entered into the system, and the producers subsequently receive timely, high quality advisories on performance status of their animals and least-cost feeding recommendations. In the USA, we see this approach as the model for expanded training and increased adoption rates of the LEWS technology. In Africa, we are relying more on distribution of CD training guides that can be played on a laptop in a remote region for one-on-one training in interpretation and dissemination of results. Working in the initial stages with decision-makers and information disseminators alike has allowed the LEWS team to customize both the delivery method and the content of the message to the intended audience. Passing the "Believability Test"(Back to top) Second, the information consumers must also be assured that the information they are receiving is consistent, sound, and useful. The LEWS teams in East Africa have just completed a drought perception survey of pastoral communities throughout the region. Pastoralists were asked to recall their actions in the past 12 months in terms of livestock movement and sales activities. In those sites where water supply was not limiting and conflict did not constrain livestock movement decisions, the LEWS technology is providing well over 90 days of early warning before these pastoral communities perceive that forage conditions are warranting decisions on movement. In some cases, warnings were indicating needed actions well over six months before the pastoralists took action. Discussions with the pastoral communities, after showing the products of the LEWS technology relative to their decision making process, indicated that they value the information but that it needs to be packaged for their particular decision-making environment. Village speakers interpret the LEWS data for village leaders who in turn provide guidance to the community. Posting of graphs and reports at community gathering points or communication nodes such as markets, clinics, livestock supply stores, or NGO/District offices were also identified as important communication methods. In areas with low literacy rates, we are exploring use of rural radio broadcasts of the reports. Studies in the USA by our research team have indicated that ranchers will use the Internet to access information and analysis they feel is reliable and meets the need of critical decision, particularly when uncertainty prevails (Zander and Stuth 2003). However, they too insist on the "believability" test. Once they acquire the LEWS reports, the information provided must track their own observations. Like Africans, US ranchers want the information in different forms. Small livestock producers seem to want more general data as an "index" of how forage conditions are developing and potentially impacting their operations. Essentially, they want to know "how bad is it?" Larger livestock producers in the Texas LEWS network have requested customized and protected access to the information system where they can specify the longitude/latitude of a rain gauge, link that gauge to one of the PHYGROW representative plant communities, record rainfall events as they occur and then let the output reflect the forage conditions, deviations, percentile ranks and forecasts relative to the variation recorded on their property. Although we have not implemented this level of resolution in the Texas LEWS program, we are currently developing a mechanism for a customized system that has protected access to help livestock producers represent more site-specific conditions than is allowed with the current 25 x 25 km gridded system. Communicating warnings(Back to top) ABOVE NORMAL (>20%) |
|
|
The delineations appear to be coarse enough to allow rapid appraisal of the maps by non-technical people, yet allow the maps to visually represent forage response over the 7 to 10 day reporting sequence when major changes in forage condition occur at the regional scale (Examples of time sequenced maps can be seen on the African LEWS web site). Summary and conclusions(Back to top) The LEWS experience to date indicates that more timely and accurate information leads to improved decision-making. Quantification of data that has demonstrated consistency in outcomes provides decision-makers with an objective information base for formulating decisions that affect the lives and livelihood of pastoral communities. This allows a more rational approach to risk management. The paradigm we are using places automated information technology in a stable computing environment with low maintenance needs and the ability to generate output in varied formats relevant to specific audiences. It provides a cost-effective mechanism for using the power of advanced technology while also maximizing the value of high-impact outreach activities through existing information infrastructures. Future advances in space-based monitoring technology coupled with new analytical techniques and greater computing power have the potential to vastly improve upon the LEWS technology package. We believe the LEWS systems can be integrated with other information systems, such as those capturing marketing and biosecurity data, in order to further meet the information needs of livestock producers worldwide. Acknowledgments(Back to top) References(Back to top) Angerer, J.P., J.W. Stuth, F.P. Wandera, and R.J. Kaitho. 2001. Use of satellite-derived data to improve biophysical model output: An example from Southern Kenya. Paper presented at Sustainable Agriculture and Natural Resource Management (SANREM) Research Synthesis Conference, Athens, Georgia, November 28-30. Online: http://www.sanrem.uga.edu/sanrem/conferences/nov2801/waf/satelitteDataImprovedOutput.htm (accessed 30 June 2003). Box, G.P., G.M. Jenkins, and G.C. Reinsel. 1994. Time series analysis: forecasting and control. 3rd ed. Upper Saddle River, N.J.: Prentice Hall. Corbett, J., J.W. Stuth, P.T. Dyke, and A. Jama. 1998. New tools for the characterization of agricultural (crop and livestock) environments: The identification of pastoral ecosystems as a preliminary structure for use in sample site identification. In Proceedings on pastoral early warning systems for Ethiopia, 31-40. Addis Ababa, Ethiopia. Funk, C., J. Michaelsen, J. Verdin, G. Artan, G. Husak, G. Senay, H. Gadain, and T. Magadazire. 2003. The collaborative historical African rainfall model: Description and evaluation. International Journal of Climatology 23:47-66. Herman, A., V.B. Kumar, P.A. Arkin, and J.V. Kousky. 1997. Objectively determined 10-day African rainfall estimates created for famine early warning systems. International Journal of Remote Sensing 18:2147-2159. Higgins, R.W., W. Shi, and E. Yarosh, 2000: Improved United States precipitation quality control system and analysis. NCEP/Climate Prediction Center Atlas Number 7, 40 pp. Online: http://www.cpc.ncep.noaa.gov/research_papers/ncep_cpc_atlas/7/index.html (accessed 25 June 2003). Hutchinson, M.F. 1991. The application of the thin plate smoothing splines to continent-wide data assimilation. In Data assimilation systems, ed. J.D. Jasper 104-113. Bureau of Meteorology Research Centre (BMRC) Research Report No. 27. Melbourne: Bureau of Meteorology. Jama, A., M. Kingamkono, W. Mnene, J. Ndungu, A. Mwilawa, J. Sawe, S. Byenkya, E. Muthiani, E. Goromela, R. Kaitho, J. Stuth, and J. Angerer. 2003. Field verification of simulated grazed forage standing crop using the PHYGROW model and satellite-based weather data. USAID Global Livestock CRSP, Research Brief 03-03-LEWS. Jochec, K.G., J.W. Mjelde, A.C. Lee, and J.R. Conner. 2001. Use of seasonal climate forecasts in rangeland-based livestock operations in West Texas. Journal of Applied Meteorology 40(9): 1629-1639. Kaitho, R., J. Stuth, J. Angerer, A. Jama, W. Mnene, M. Kingamkono, J. Ndungu, A. Mwilawa, J. Sawe, S. Byenkya, E. Muthiani, and E. Goromela. 2003. Forecasting near-term forage conditions for early warning systems in pastoral regions of East Africa. USAID Global Livestock CRSP, Research Brief 03-02-LEWS. Lyons, R.K. and J.W. Stuth. 1992. Fecal NIRS equations for predicting diet quality of free ranging cattle. Journal for Range Management 45:238-243. Nicks, A.D., C.W. Richardson, and J.R. Williams. 1990. Evaluation of the EPIC model weather generator. In EPIC-Erosion/Productivity Impact Calculator, 1. Model documentation, eds. A. N. Sharpley and J. R. Williams, 105-124. USDA-ARS Technical Bulletin 1768. SAS Institute, Inc. 1999. Procedures guide for personal computers, Version 8 edition. Cary, N.C.: The Institute. Schumann, K.D., J.R. Conner, J.W. Richardson, J.W. Stuth, W.T. Hamilton, and D.L. Drawe. 2002. The use of biophysical and expected payoff probability simulation modeling in the economic assessment of brush management alternatives. Journal of Agricultural and Applied Economics 33:539-549. Svoboda, M., D. LeComte, M. Hayes, R. Heim, K. Gleason, J. Angel, B. Rippey, R. Tinker, M. Palecki, D. Stooksbury, D. Miskus, and S. Stephens. 2002. The Drought Monitor. Bulletin of the American Meteorological Society 83:1181-1190. Stuth, J. W., J. Angerer, R. Kaitho, A. Jama, and R. Marambii. 2003. Livestock Early Warning System for Africa rangelands. In Agricultural drought monitoring strategies in the world, ed. V. Boken. Forthcoming. Zander, K. and J. Stuth. 2003. Potential adoption rates by producers of an online decision support system for grazing management. National Grazing Lands Conservation Conference, Nashville, Tennessee. Forthcoming. Xie, P. and P.A Arkin. 1998. Global monthly precipitation estimates from satellite-observed outgoing long wave radiation. Journal of Climate 11:137-164. |
![]()
(Back to top)
All authors are in the Ranching Systems Group - Center Natural Resource Information
Technology and Center for Grazingland and Ranch Management in the Department
of Rangeland Ecology and Management, 2126 TAMU, Texas A&M University, College
Station, Texas 77843-2126. For additional information contact Dr. Jerry Stuth
at this address or phone 979-845-5548 or email at jwstuth@cnrit.tamu.edu.
(Back to top)
African Livestock Early Warning System (LEWS) portal
http://cnrit.tamu.edu/aflews
Texas LEWS portal
http://cnrit.tamu.edu/txlews
New Mexico LEWS portal
http://cnrit.tamu.edu/nmlews
Noble Foundation LEWS portal
http://cnrit.tamu.edu/noble
Livestock Nutritional Advisory System
http://cnrit.tamu.edu/autosystem
US Forage Condition Weather Data System
http://cnrit.tamu.edu/usweather/weather.cgi
Collaborative Historical African Rainfall Model (CHARM) portal
http://cnrit.tamu.edu/charm
LEWS Africa Weather Data Access portal
http://cnrit.tamu.edu/rsg/rainfall/rainfall.cgi
LEWS Africa interactive maps
http://cnrit.tamu.edu/maps/map_init.html
FEWSNET/African Data Dissemination Service
http://edcw2ks21.cr.usgs.gov/adds/
RANET
http://www.ranetproject.net
Soil Water Characteristics: Hydraulic Properties Calculator
http://www.bsyse.wsu.edu/saxton/soilwater/
National Drought Monitoring Center's "Drought Monitor"
http://www.drought.unl/edu/dm/
About the Arid Lands Newsletter