Module Output:
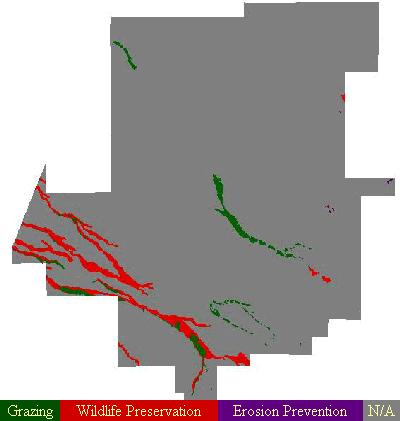
Before any map is outputted, the site user must make a series of value judgments (low, medium, high) concerning Income Potential (grazing), Erosion Prevention, and Wildlife Conservation. Upon submitting values for these three categories, a pre created Arc view map of the SRER is displayed. For example, submitting values of High-Income, Low-erosion, and Medium-wildlife will produce a map that looks as follows:
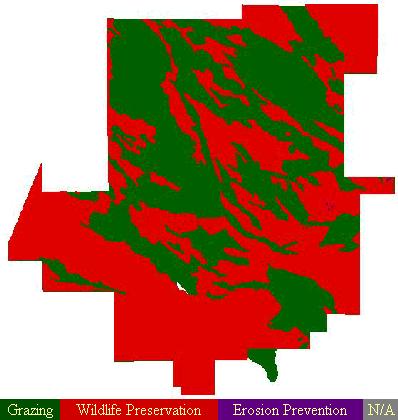
With three categories (income, wildlife, erosion) and three different
value ratings (high, medium, low), there is a possibility of 27 (3^3) different
map outputs. All of which are created by combining various aspects
of the following three maps.
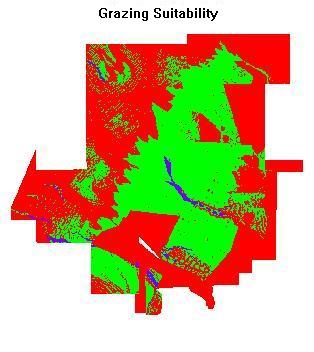
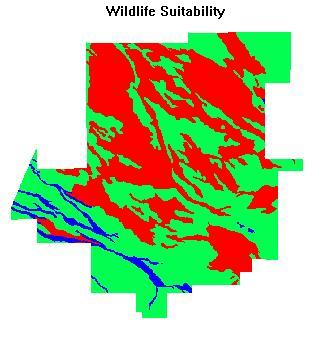
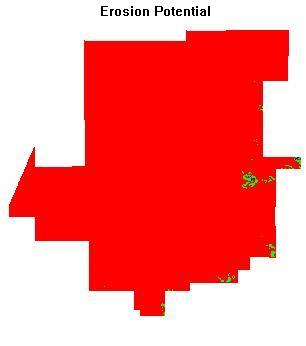
Each of these maps illustrate a range of three values. For grazing
and wildlife suitability, green indicates good areas, purple indicates
fair areas, and turquoise indicates poor areas. For erosion potential,
green indicates high erosion, purple indicates medium erosion, and turquoise indicates low erosion. These three values for each map are used
to generate each composite map displayed in the module. The category
ratings and individual map values are organized as follows:
- Low rating: considers the highest value areas in the specified category
- Medium rating: considers both the middle and highest values in the specified category
- High rating: considers all three values in the specified category
Notice that the areas suggested for wildlife conservation are the same areas given a "good" rating on the wildlife suitability map. The same applies to the suggested grazing and erosion prevention areas.
For more complicated outputs, it was necessary to define a few general
guidelines.
- The category given the highest rating takes precedence over lower rated categories.
- In cases where categories are given the same rating, grazing was given highest preference, second to wildlife, and third to erosion prevention.
USE YOUR BACK ARROW TO RETURN