The single use output is the result of a simple calculation performed on the numbers supplied in the single use table. To illustrate how this works lets assume that the table was filled out as below.
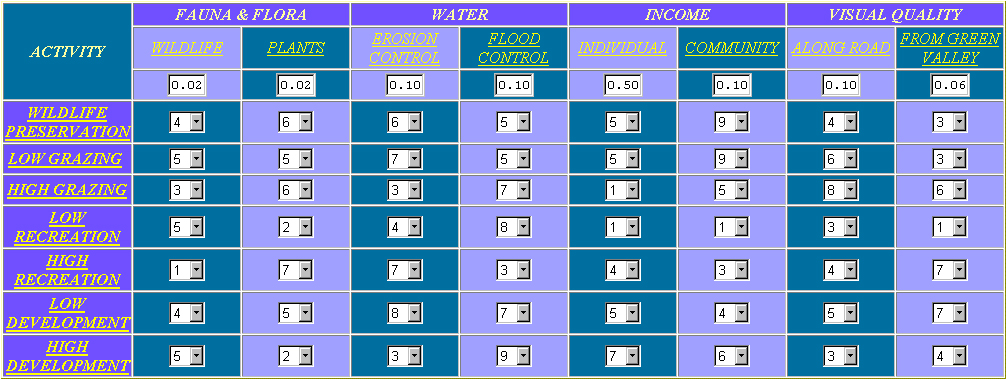
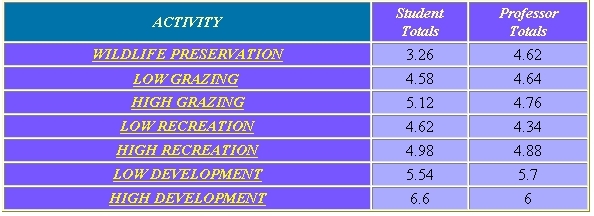
When this table is submitted, the value ratings (the decimal #'s) are multiplied to each number within the collum. This multiplication is conducted for each of the 8 columns. These new values are then added across (left --> right) for each of the seven rows and reported in the output as follows.
Notice that there are two columns of outputted values. The first column, titled "Student Totals", was calculated purely from your inputted data. The second column used your value ratings (decimal #'s) in combination with responses of natural resource experts to calculate the displayed values. These experts were asked fill out the same table that you filled out with the exception of making the resource value judgements. Their responses were then averaged. Notice that the outputted values for this collum will change depending on how you rate each of the different resources (ie, wildlife, plants, income, etc).
Please note that not even the experts came up with exactly the same estimates, so don't worry if your numbers look different. You just need to be able to justify your responses and possibly indicate why any differences may have occured.
USE YOUR BACK ARROW TO RETURN