Deconvolving
the microarrays:
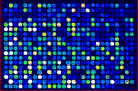
The initial format (Print Format 1) involved two large arrays which were printed sequentially: Array 1 was printed using 32 pins, and comprises 27 x 27 subarrays. Array 2 was printed using 8 pins and comprises 27 x 18 subarrays (Powerpoint file). This format provides 27,216 available element addresses, not all of which were employed for printing. Print Format 2 (which is used currently) involves one array printed using 48 pins. It comprises 12 metarows and 4 metacolumns, and the subarrays comprise 24 columns and 25 rows. The dimensions of typical microarrays are given here (Powerpoint file). The deconvolution files linking array
elements with corresponding gene identifiers are now routinely provided below
as Excel files (*.xls). Other formats (text files (*.txt), GenePix
Array List files (*.gal)) are available on request. Wherever possible,
the name of the microarray print run is included in the file header as a
cross-check. For an Excel file linking identifier to At locus number and sequence, please follow this link. For a discussion of QC aspects of deconvolution, please follow this link.
*.gal = GenePix
Array List file format On all microarrays, we include array elements comprising the Stratagene SpotReportTM Oligo Array Validation System. This permits use of external normalization methods. The element locations are listed in the deconvolution files.
Relating
Oligo identifier to A. thaliana locus, ecotype polymorphisms, and Salk
insertions:
This Excel spreadsheet (11 Mbytes) provides information linking the individual oligonucleotide elements to their corresponding gene loci. It also provides information about the occurrence of ecotype polymorphisms, and the relationship between the loci and Salk T-DNA insertion lines. Oligo
Microarray Database:
The OMAD website
(Qiagen Operon) provides a searchable database linking array oligonucleotides
to gene loci. Questions
or comments should be addressed to: David Galbraith |
||||||||||||||||||||||||||||||||||||||||||||||||||||||||||||||||||||||||||||||||||||||||||||||||||||||||||||||||||||||||||||||||||||||||||||||||||||||||||||||||||||||||||||||||||||||||||||||||||||||||||||||||||||||||||||||||||||||||||||||||||||||||||||||||||||||||||||||||||