Water Arizona Water Fact Sheets Water Irrigation Efficiency Program Designed to conserve our most precious resource - water - by increasing water efficiency in crop production by at least 20%. Arizona Project WET Arizona Project WET develops water stewardship and STEM literacy by providing teacher professional development that evolves instructional practice and deepens content knowledge. Onsite Wastewater The overall objective of the Onsite Wastewater Education program is to empower the users, installers, maintainers, and regulators of onsite wastewater treatment and dispersal systems to make informed and effective choices to protect human health and the environment. Water Resources Research Center WRRC tackles key water policy and management issues, empowers informed decision-making, and enriches understanding through engagement, education, and applied research. Private Wells Pollutants such as pesticides, nitrate, and pathogens entering groundwater and surface waters are health hazards to Arizona communities who rely on both groundwater and surface water for their drinking water. Cochise Water Wise Engaging Cochise County adults and children in stewardship of our precious water resources here in our arid High Desert climate. The program focuses on educating anyone in the Sierra Vista Subwatershed about the many ways we can conserve water indoors and outdoors. The youth program conducts water education and conservation lessons in Cochise County classrooms, after-school events, and summer youth programming. Water Quality and Sustainability Water quality, sustainability, and security are of increasing importance with current rates of population growth and water usage in arid and semiarid ecosystems. Water in the Native World Webinar Series Bringing to the forefront and address water challenges facing Indigenous communities in research led by Indigenous hydroscientists Smartscape Smartscape is a comprehensive training program that instructs landscape and irrigation professionals in the fundamentals of design, installation, irrigation, and maintenance of desert-adapted landscapes.
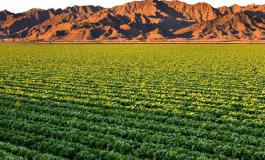
Water Irrigation Efficiency Program Designed to conserve our most precious resource - water - by increasing water efficiency in crop production by at least 20%.
Arizona Project WET Arizona Project WET develops water stewardship and STEM literacy by providing teacher professional development that evolves instructional practice and deepens content knowledge.
Onsite Wastewater The overall objective of the Onsite Wastewater Education program is to empower the users, installers, maintainers, and regulators of onsite wastewater treatment and dispersal systems to make informed and effective choices to protect human health and the environment.
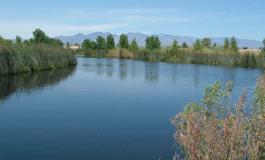
Water Resources Research Center WRRC tackles key water policy and management issues, empowers informed decision-making, and enriches understanding through engagement, education, and applied research.
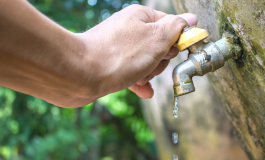
Private Wells Pollutants such as pesticides, nitrate, and pathogens entering groundwater and surface waters are health hazards to Arizona communities who rely on both groundwater and surface water for their drinking water.
Cochise Water Wise Engaging Cochise County adults and children in stewardship of our precious water resources here in our arid High Desert climate. The program focuses on educating anyone in the Sierra Vista Subwatershed about the many ways we can conserve water indoors and outdoors. The youth program conducts water education and conservation lessons in Cochise County classrooms, after-school events, and summer youth programming.
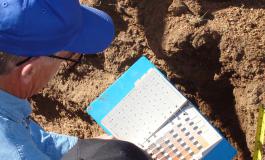
Water Quality and Sustainability Water quality, sustainability, and security are of increasing importance with current rates of population growth and water usage in arid and semiarid ecosystems.
Water in the Native World Webinar Series Bringing to the forefront and address water challenges facing Indigenous communities in research led by Indigenous hydroscientists
Smartscape Smartscape is a comprehensive training program that instructs landscape and irrigation professionals in the fundamentals of design, installation, irrigation, and maintenance of desert-adapted landscapes.