Using geospatial technologies to understand dryland dynamics
![]() No.
51, May/June 2002
No.
51, May/June 2002
Using
geospatial technologies to understand dryland dynamics
by Pat S. Chavez, Jr.,
David J. Mackinnon,
Richard L. Reynolds, and Miguel G. Velasco
|
In this study by the U.S. Geological Survey, researchers are investigating "remotely sensed satellite, airborne, and ground-based image data to determine their ability to detect and monitor active dust storms, as well as to map areas vulnerable to wind erosion." |
Note: Any use of trade, product, or firm names is for descriptive purposes only and does not imply endorsement by the U.S. Government. Introduction(Back to top) As part of a study of landscape vulnerability to wind erosion and the potential impacts of dust, we are investigating remotely sensed satellite, airborne, and ground-based image data to determine their ability to detect and monitor active dust storms, as well as to map areas vulnerable to wind erosion. A main objective has been to investigate the use of high temporal resolution digital images collected by satellite and a long-term, ground-based digital camera station, along with wind data collected at our field sites, to detect, monitor, and analyze the location, size, frequency, duration, and transport patterns of dust storms in the Mojave Desert of the southwestern United States. Generally, many current methods and instruments are not developed to the level required to routinely detect and monitor dust storms or to develop models that accurately predict total dust flux and emission rates. Improving these capabilities is critical to generating baseline datasets for assessments of landscape vulnerability to future climate change. On going modeling efforts are attempting to identify meteorological parameters and soil surface roughness parameters needed to predict the vulnerability of various geomorphic substrates to wind erosion. Datasets to calibrate model results are difficult to collect and typically not available. Results of our studies, incorporating digital image maps and new methods using remotely sensed images to identify and monitor dust sources, will be useful for the calibration of dust-emission models of the Mojave Desert and other arid environments. At the same time, we are exploring new methods to map the amount, sizes, and spatial distribution of particles at the surface to enable detailed wind-erosion vulnerability mapping at a regional scale. Setting(Back to top) |
|
|
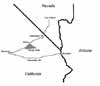
Remotely sensed images, field surveys, and long-term, ground-based instrumentation are being used to monitor sand saltation, dust emission, vegetation cover and change, short-term meteorological parameters, and soil conditions. The roughly triangular area of detailed study is delineated on the north by the town of Baker, on the southwest by Afton Canyon of the Mojave River, and on the southeast by the Kelso Mountains. This area encompasses sand dunes, drainages, stream channels, and a large playa (Soda Dry Lake). The wind transport system here responds to both direct and indirect effects of climatic change over various time scales (Lancaster, 1997). During the Pleistocene, eolian sediments derived from the deflation of lacustrine deposits were exposed by fluctuating lake levels. During the Holocene, in contrast, the intensity and timing of eolian activity (sand movement and dust emission) have been controlled on time scales of hundreds to thousands of years by sediment supplied from stream channels (Kelso Wash and the Mojave River) and temporary lakes and by vegetation cover as controlled by precipitation; wind strength has not been a limiting factor on eolian activity (Lancaster, 1997). In recent times, eolian activity on yearly to decadal time scales has been similarly controlled by alluvial sources and by vegetation cover. Detailed study of wind erosion and dust emission, along with meteorological monitoring, is conducted at three distinctive geomorphic settings, each scoured by wind: the playa margin on a shallow-gradient slope that carries sheet wash during rare flooding, a small but periodically active wash, and the broad outwash plain of the Mojave River. At each site, small coppice dunes are common, and surficial deposits in the top 15 cm are dominantly sandy (typically greater than 80-percent sand). Deposits between dunes and in washes commonly have silt/clay content of 20 to 50 percent. Two of the sites are within a national preserve wilderness area protected from heavy human use, and the third is within the preserve but not in the wilderness section. Methods and discussions(Back to top)
|
|
|
(Back to top) |
|
|
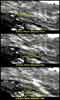
The only imaging system that has the temporal resolution needed to detect and monitor active dust storms and other short-lived events is the GOES system (Table 1). Because of the poor spatial and spectral resolutions of GOES images, however, we have been able to detect and monitor only very large dust storms in the Mojave Desert using these data. As an example, several GOES visible band images collected on April 23, 1997, revealed dust plumes during a major regional wind event that occurred in the Mojave Desert (Fig. 3). These dust plumes were active for several hours in the Soda Dry Lake and Fort Irwin areas. We have used three different methods to detect dust storms with GOES visible band images: (1) a change procedure to generate digital change images, (2) a change- visualization procedure, and (3) movies. In the first two cases, two GOES images collected at approximately the same time of day on two different dates are used in the analyses - one imaged during the windy day when airborne dust is potentially present, and a second imaged on a calm day within a day or two of the windy day image. Using two images collected at approximately the same time of day ensures that topographic shadowing conditions are similar. Moreover, using images collected within one or two days of each other eliminates differences related to land-surface change. The change-visualization method is one in which the detection is accomplished visually by displaying the contrast-enhanced images collected during the windy and non windy days and blinking between them (i.e., alternate between the windy and non windy day images either slowly or rapidly). The third alternative is to use a visualization procedure by making a movie of a set of all windy-day images (i.e., GOES images collected 15 to 30 minutes apart for several hours). This option allows the viewer to see the distribution, relative size, and transport patterns of the dust plumes from several sources in the region during the wind event. A movie made using GOES images collected during a dust storm reveals information about transport patterns and relative emission rates during the entire wind event. |
|
|
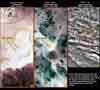
Compared with the 1-km resolution GOES images, a higher resolution image, such as Landsat TM, collected during the dust storm, can map the location of dust sources more accurately. Of course, this type of image data can be used only in those rare cases when the satellite is over the site at the time of the dust storm during cloud-free days. When one of the higher spatial resolution imaging systems is at the right place at the right time, with clear sky conditions, very detailed information about the location of the dust site, amount of dust being generated from different areas, and transport patterns can be extracted from the image. As an example, a dust storm imaged by the Landsat Multispectral Scanner (MSS), with approximate 75-m spatial resolution, captured dust emission during a wind event on January 1, 1973 (Fig. 4). The spectral resolution of SeaWiFS images is one of the better ones available on board a satellite-imaging system for detecting dust plumes. SeaWiFS images have been used to detect the very large dust plumes generated by winds in Africa and Asia (e.g., Husar and others, 2001; Prospero, 1999). However, dust plumes from these areas are easier to detect using satellite images than those in the Mojave Desert because they are much larger, last longer, and, more important, have a dark (low-radiance) background (i.e., the ocean). In the Mojave Desert, the dust plumes are much smaller, shorter lived, and occur over areas with a bright (high-radiance) background that is similar to the radiance of the airborne dust (i.e., the desert surface). Dust detection over desert areas using SeaWiFS images can be difficult because the recorded radiance values are converted to digital numbers using a nonlinear transformation that optimizes for dark/low radiance levels of the ocean waters. Owing to the nonlinear transformation, the range of digital numbers over bright desert areas is minimized, which makes it difficult, if not impossible, to detect anything but the very largest global airborne dust plumes over desert areas. With respect to spectral bands, the Total Ozone Mapping Spectrometer (TOMS) is the only available satellite-imaging system that is probably better suited than SeaWiFS for airborne dust detection. However, with its low spatial and temporal resolutions, it is more of a global-scale mapping tool. For this reason, TOMS is not useful in detecting and monitoring typical dust storms in the Mojave Desert. |
|
|
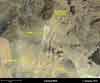
(Back to top) Some of the major components of the stand-alone, ground-based camera station include a Kodak DC265 digital camera, Campbell data logger, solar panel, Handar ultrasonic wind sensor, and software to control the digital cameras and data logger (Tigges and others, 2001). Three digital cameras are pointed to the sites where Climate Impact Meteorological Stations (CLIM-MET) are located and take photographs when the winds at one station exceed a pre-selected threshold (currently set at about 6.7 m/s). A fourth camera, pointed toward the area north of Baker, Calif. (just north of Soda Dry Lake), acquires digital photographs at 9:30 a.m. and 2:30 p.m. every day for visibility change detection and analyses. Compared with satellite images, the ground-based digital photographs allow more precise identification of the dust-source locations and provide information about the frequency, size, and duration of dust storms not captured by satellite systems owing to their poor temporal and/or spatial resolutions, as well as cloud cover. The ground-based photographs also contain information about local transport patterns and emission rates when analyzed in conjunction with wind speeds required to suspend dust at these locations for the existing surface and the antecedent climatic conditions. Part of the current effort is to use data collected by the ground-based system to calibrate satellite images. Mapping landscape vulnerability to wind erosion (Back to top) A simple model has been developed using multispectral satellite image data to generate a wind erosion vulnerability image (WEVI) that is directly related to the amount of vegetation cover and surface characteristics. The red and near-infrared spectral bands from satellite image data are used to generate an image that emphasizes areas with a low percentage of vegetation cover/density and/or high surface-soil reflectance. High vulnerability is expressed in areas where these two conditions occur simultaneously. The near-infrared and red spectral bands, along with the ratio of the red to near-infrared bands, are used as the red, green, and blue components, respectively, to make a color composite. The resulting image highlights areas with low vegetation density and high surface-soil reflectance in various shades of yellow. In this type of image, therefore, pixels having various shades of yellow are generally areas that have a medium to high vulnerability to wind erosion. Areas with high vegetation density and/or low surface reflectance, shown in various shades of blue, have a low vulnerability to wind erosion. We are currently in the process of improving the model by combining a digital elevation model (DEM) with the satellite image data. This combination will allow areas with relatively steep slopes, such as mountains and high-relief alluvial fans, to be identified and mapped as not vulnerable to wind erosion. We are also investigating the use of high spectral resolution image data to detect the amount and spatial distribution of clay, silt, and sand. The WEVI results show that the most vulnerable areas occur on the relatively flat valley floors and more gentle fan geomorphology, while the more hilly and mountainous terrains are less vulnerable to not vulnerable to wind erosion, because there is fine-grained sediment on valley floors, as opposed to coarse-grained, immovable (by wind) sediment on fans and mountain fronts. An example of the WEVI generated using the red and near-infrared bands for areas in the Mojave Desert, along with other digital image map results, including a digital Landsat TM mosaic covering a large part of the Southwestern United States, can be seen at the project web site (address given below). Our current work involves developing new algorithms and procedures for extracting surface textural and armoring parameters and soil types from remotely sensed images. The algorithm to extract surface armouring from satellite and airborne image data will map the level of 'sheltering' of the surface soil related to the amount of vegetation cover and rocks (pebbles and gravel). Results and conclusions(Back to top) Using information derived from the satellite images, ground-based digital photographs, and wind data, we can say the following about the vulnerability of the Soda Dry Lake area during the relatively dry surface conditions in spring 2002:
Since the development of the civilian satellite imaging capabilities in the late 1960s, the spatial and spectral resolutions of imaging systems have improved substantially. However, the temporal resolution has not improved much since the mid-1970s. Data having more than 100 m spatial resolution and multiple spectral bands are operationally collected only about every 2 weeks for any given location on the Earth's surface by a single satellite. Some satellite-imaging systems have a relatively improved temporal resolution of one per day, but a spatial resolution of 300 to 1,000 m. To monitor short-lived events, such as dust storms, suspended sediment plumes in coastal and river environments, and volcanic ash clouds, the temporal resolution of good spatial resolution imaging systems needs to be improved markedly to more than once per day. A basic system that would allow a major advancement in the detection and monitoring of short-lived events would have three to five spectral bands with approximately 100 m spatial resolution and temporal resolution of 15 to 30 minutes. It is technically feasible today to develop such a system. We must also keep in mind that often the event of interest, such as a windstorm, occurs during the night when visible and near-infrared imaging systems are not useful. Therefore, thermal imaging capability is necessary with day and night thermal imaging every 15 to 30 minutes with 100 to 200 m spatial resolution. Acknowledgments(Back to top) References(Back to top) Chavez, P.S., Jr., and D.J. MacKinnon. 1994. Automatic detection of vegetation changes in the Southwestern United States using remotely sensed images. Journal of Photogrammetric Engineering and Remote Sensing 60(5):571-583. Gillette, D.A. and R. Passi. 1988. Modeling dust emission caused by wind erosion. Journal of Geophysical Research 93:14,233-14,242. Gillette, D.A. and K.J. Hanson. 1989. Spatial and temporal variability of dust production caused by wind erosion in the United States. Journal of Geophysical Research - Atmospheres 94:2,197-2,206. Husar, R.B., D.M. Tratt, B.A. Schichtel, S.R. Falke, F. Li, D. Jaffe, S. Gasso, T. Gill, N.S. Laulainen, F. Lu, M.C. Reheis, Y. Chun, D. Westphal, B.N. Holben, C. Gueymard, I. McKendry, N. Kuring, G.C. Feldman, C. McClain, R.J. Frouin, J. Merrill, D. DuBois, F. Vignola, T. Murayama, S. Nickovic, W.E. Wilson, K. Sassen, N. Sugimoto, and W.C. Malm. 2001. Asian dust events of April 1998. Journal of Geophysical Research 106:18,317-18,330. Lancaster, N. 1997. Response of eolian geomorphic systems to minor climate change: examples from the southern California deserts. Geomorphology 19:333-347. MacKinnon, D.J., and P.S. Chavez, Jr. 1993. Dust storms, May 1993. Earth Magazine, pp. 60-64. Marticorena, B., G. Bergametti, D. Gillette, and J. Belnap. 1997. Factors controlling threshold friction velocity in semiarid and arid areas of the United States. Journal of Geophysical Research 102:23,277-23,288. Prospero, J.M. 1999. Long-range transport of mineral dust in the global atmosphere: Impact of African dust on the environment of the Southeastern United States. Proceedings of the National Academy of Science 96:3,396-3,403. Tigges, R.K., S.C. Sides, and M. Ohms. 2001. Automated Remote Digital
Imaging System (ARDIS): Applications for monitoring dust emissions in
the Mojave Desert, California. U.S. Geological Survey Open-File Report
01-0230.
|
![]()
(Back to top)
All of the authors of this paper work for the U.S. Geological Survey, which
is sponsoring this research as part of its Southwest Climate Impacts project.
You can reach Dr. Chavez for comment about this article by email at pchavez@usgs.gov.
(Back to top)
Using Remote Sensing to Detect Active Dust Storms and Map Areas Vulnerable
to Eolian Erosion
http://Terraweb.wr.usgs.gov/projects/RSDust/
The official web site for the project described in this article.
Southwest Climate Impact Meterological Stations (CLIM-MET)
http://climchange.cr.usgs.gov/info/sw/clim-met/
The CLIM-MET meterological stations are implemented under the auspices of the
USGS's Southwest
Climate Impacts project, which seeks to understand how climate (such as temperature;
precipitation; wind direction and strength) and how human activities affect
geologic processes (such as weathering; erosion; deposition) that modify the
landscape.
USGS Southwest Climate Impacts project
http://climchange.cr.usgs.gov/info/sw/index.html
The goals of this USGS project are to understand how past climatic changes affected
the land's surface; today's interplay among climate, land use and surface processes
(both geologic & ecologic); and impacts of future climate on the land surface.
About the Arid Lands Newsletter