Fire Ecology II
![]() No.
55, May/June 2004
No.
55, May/June 2004
Fire Ecology II
by Matt Brooks, John Matchett, Cynthia Wallace, and Todd Esque
| "This paper provides an example of how coarse-scale fuels and fire hazard assessments can be accomplished using existing vegetation maps, digital elevation maps, fire behavior models, and a basic understanding of fuel structure and potential fire behavior in desert ecosystems." |
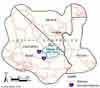
Introduction(Back to top) Fuel and fire hazard maps do not currently exist for many of the arid and semi-arid desert grasslands, shrublands, and woodlands of North America. This is primarily because there is little information on fuel characteristics and fire behavior in these regions where fires have been historically infrequent (Brooks and Pyke 2001). However, fire frequencies have increased since the late 1970s, due both to increased human-caused fires and to increased continuity and ignitability of fine fuels caused by the growing dominance of alien annual grasses (Brooks and Esque 2002; Brooks and Minnich in review). These developments have made the lack of fire maps an increasing liability for land managers in desert regions. Using the Mojave National Preserve (located in the Mojave Desert of the southwestern U.S.) as an example, this study discusses how fuel maps can be created using vegetation and slope data, focusing specifically on estimated fire spread rate and intensity. The study maps also describe spatial patterns of road density (roads being a primary source of human-caused fires) and lightning density, and compare their respective correlations with human-caused and lightning-caused fires. Collectively, these analyses are designed to provide information for managers at the Mojave National Preserve that will help them in developing their Fire Management Plan. Study area |
|
|
(Back to top) Fuels Mapping |
|
|
(Back to
top) |
|
|
Next, using available representative data on continuity and fuel loads for each cover category from Brooks (1999, 2002), Brooks et al. (2003), Brooks and Minnich (in review), and our unpublished data and personal observations, we extrapolated overall regional continuity/fuel load values for each of the 76 cover categories (Table 1). We then estimated the predicted relative spread rate and intensity of fire for each cover category as high, medium or low. These data were then used to create maps of predicted fire spread rate and fire intensity within the Preserve based solely on vegetation properties (Figure 2). |
|
|
In addition to vegetation properties, the slope of the terrain is another important variable controlling fire behavior. Fire generally burns with greater intensity on slopes because upslope fuels are preheated and dried from the fire below, and fire spreads faster because upslope fuels readily come into direct contact with the flames below. We further refined our fire spread and intensity maps to include slope affects by adding 3 slope levels (low, medium, and high), which were derived from a digital elevation map (US Geological Survey) (Figure 3). These slope values were combined with the previously derived spread rate/intensity values to produce a matrix of 9 potential vegetation-slope combinations of fire spread rate and intensity within the preserve. |
|
|
The fire behavior patterns within these 9 vegetation-slope combinations were analyzed using BehavePlus, a freely available software tool for predicting fire behavior in wildland fuels. BehavePlus includes 13 predefined fuel models, which can be used to predict local fire behavior. We used the grass fuel model to represent vegetation types likely to have high spread rate and low fire intensity, the dormant shrub model to represent vegetation types with low spread rate and high fire intensity, and interpolated between the two curves to represent vegetation types with medium spread rate and intensity (Figure 4). |
|
|
Each of the 9 vegetation-slope combinations was assigned a relative value ranging from 1 (lowest) to 6 (highest.) for both fire spread rate and fire intensity (Figure 4). In some cases more than one vegetation-slope combination was predicted to have a similar spread rate or intensity, in which case we assigned a similar fire behavior ranking. For example, a vegetation type initially classified as having a medium spread rate and occurring on a low slope would have a similar slope-adjusted spread rate as a vegetation type initially classified as low spread rate but occurring on a high slope; therefore, each of these two vegetation-slope combinations was assigned a slope-adjusted spread rate ranking of 3. |
|
|
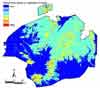
These analyses resulted in fire spread rate and intensity maps that were based both on vegetation and slope properties (Figure 5). The spread rate and intensity maps were finally combined (with equal weighting) to produce a composite fire behavior map (Figure 6). The maps produced through these steps comprise a suite of flexible and powerful tools for land managers. Depending on their specific concerns, managers can use either the spread rate, the intensity, or the composite fire behavior maps to determine where they should pre-position fire suppression resources during the fire season, or develop strategies for controlling wildfires once they occur. Fire hazard assessment(Back to top) |
|
|
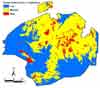
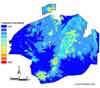
Frequency of human-caused fires was correlated with road density (r = 0.47), especially along the Interstate Highway15 (I-15) corridor at the northern edge of the study area (Figure 7). The positive association between roads and fires is a general pattern that occurs throughout the Mojave Desert (Brooks and Esque 2002). This pattern is likely due to both higher vegetation cover (Johnson et al. 1975; Frenkel 1977) and frequencies of ignitions along roadsides compared to other places in desert landscapes. |
|
|
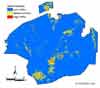
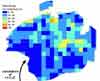
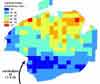
In contrast, the frequency of lightning-caused fires was only weakly correlated with lightning density (r = 0.19). Fires caused by lightning were concentrated in the Mid-Hills area in the center of the study area, whereas lightning strike density was highest across the northern part of the study area (Figure 8). One possible explanation for this concentration of lighting-caused fires is that the Mid-Hills area contains some of the most extensive areas of big sagebrush and juniper in the study area. These vegetation types are among the most flammable in the Mojave Desert, with relatively high spread rate and fire intensity potentials (Brooks and Minnich in review). These analyses provide an evaluation of where human and natural caused fires are most likely to occur within the Mojave National Preserve. Pre-positioning of fire suppression resources near the Mid-Hills area would place these resources in close proximity to areas where fire spread rates and intensities are predicted to be highest, and where lighting-caused fires were most prevalent from 1980 to 2001. This is currently covered well by the Hole-in-the-Wall Fire Center, an interagency station located in that area which is staffed by firefighters from both the Bureau of Land Management and the National Park Service. Although in this case the Fire Center was well-located without the use of fire maps, in an era of growing recognition of fire hazards, the use of such maps will become an increasingly important tool for allocating such resources in the future. Summary(Back to top) Although the resolution of our approach may be on the low side for use in real-time wildfire suppression tactics, it should be sufficient for landscape scale fire management planning in desert regions. The reliability of this approach can be increased most by additional information linking fuel conditions to fire behavior (i.e. custom fuel models). Along with accurate vegetation maps, the existence of accurate fuel models is the most limiting factor in any fuels and fire hazard assessment. In contrast to forests or woodlands, there has been much less research done to develop fuel models in desert regions. As a result, approaches such as the one presented in this paper can provide land managers with some level of information to use in their fire planning efforts. As new information becomes available, these assessments can easily be updated by archiving the base information in a digital format and revising it using geographical information systems (GIS) software.
|
![]()
(Back to top)
Matt Brooks, corresponding author, is a Research Botanist for the U.S. Geological
Survey, Western Ecological Research Center, Las Vegas Field Station (WERC-LVFS).
He can be reached for comment at matt_brooks@usgs.gov.
John Matchett is a Biologist and Todd Esque is a Research Ecologist at WERC-LVFS. Cynthia Wallace is a Physical Scientist for the U.S. Geological Survey Southwest Geographic Science Team, Tucson, Arizona.
(Back to top)
Mojave National Preserve
http://www.nps.gov/moja/index.htm
BehavePlus fire prediction software
http://www.fire.org
Where Desert meets City: Vulnerability and Recoverability of the Mojave Desert
Ecosystem (USGS study)
http://wrgis.wr.usgs.gov/MojaveEco/
USGS Western Ecological Research Center
http://www.werc.usgs.gov
About the Arid Lands Newsletter