The multiple use matrix (below) is quite a bit simpler than the single use. The major reason for this difference deals with where the actual data is being entered. For single use, you researched each of the land uses and their respective effects on the indicated resources. You then used this information to fill out the matrix. In fact, those relative ratings and your personal valuation of each resource provided all the information used for calculating suggested land use. Conversely, this multiple use module predicts the best areas for the multiple land uses by incorporating years of research data (already entered and pre-analyzed) and people's values (the below matrix). In short, this matrix appears much simpler because all the ecological data has already been entered for you (you don't have years to finish you project). The number of land use options has also been reduced because three categories with three value ratings means that there are a total of 27 (3^3) different maps that can be generated. If a fourth option was included, there would be 256 (4^4) different maps (I don't have years to finish either). With a little understanding of why this looks so different, lets see what needs to be done.Instructions:
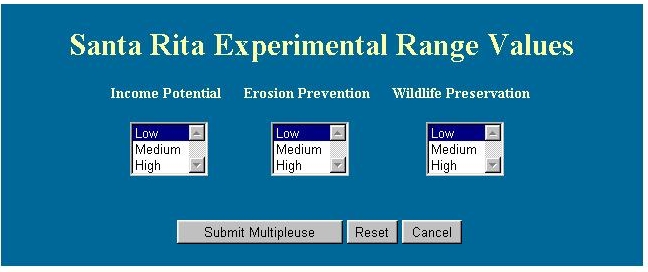
You simply enter the importance of the three factors: Income (grazing), Erosion, and Wildlife. Once selecting a high, medium, or low value, click on "Submit Multiple use".
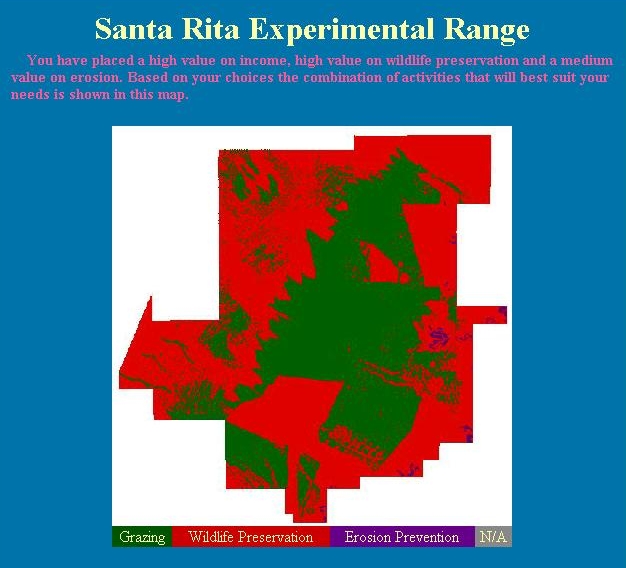
For example, I choose high, medium, and low for these three categories, respectively, and the module returns a map that looks as follows:
As the legend at the bottom of the map indicates, the green area is proposed for grazing, the red areas for wildlife preservation, and the purple areas for erosion. For a further understanding of how this map was created, refer to the multiple use explanation.
Back to Multiple Use