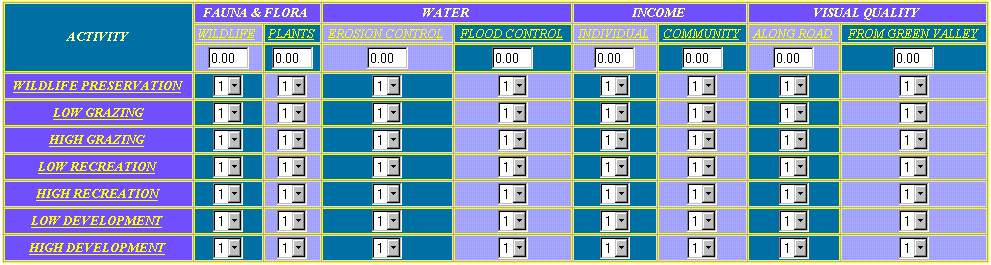
The picture shown above is the decision matrix. It contains three major components: background links (15 total), relative ranking cells (48 total), resource valuations cells (8 total).Background links:
The background links can be found by clicking on any of the underlined column or row headings. They work like any other web page link , so you just need to click the mouse cursor over the underlined word (cursor will turn into a "pointing hand"). Each of these links contains information pertaining to the selected resource (column) or land use (row).
*Note: The links above will not take you anywhere because this is only a picture. You must log into the module and go to the single use page to view these links.
Relative Ranking cells:
The relative ranking cells are these cells with a number "1" (above). You are expected to research each of the linked resource areas as well as each of the land uses. The information that you find should then be used to make an educated guess at how each land use will relatively effect a particular resource. The ratings range from 1-9 with 9 being the best land use for the resource and 1 being the worst, or most desirable and least desirable respectively. For example, we might fill out the wildlife column as displayed below:
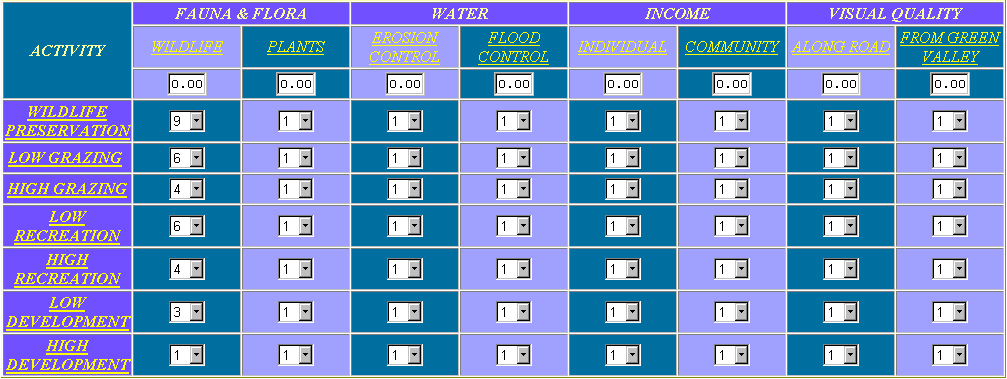
The act of preserving the land for wildlife is most definitely the best land use option when we are only concerned with providing wildlife habitat; thus it was given a value of 9. Likewise, high development involves building roads and houses, which directly removes available habitat; thus it was given a value of 1. The rest of the land use options fell somewhere between these two extremes. Notice that some land uses have the same rating which indicates that they effect wildlife to the same degree. Take a minute to really look at this and understand how these relative ratings work. If you are a bit confused, ask a fellow classmate or the instructor.*Note: Do not take these values as being correct (I just plugged them in to illustrate this point)The rest of the chart is filled out in this same manner (vertically).
Resource Valuation Cells:
The resource valuation cells are the ones that originally contain "0.00" (already been changed below). These cells, when added together, must total 1. The objective here is to put a numerical value on each of the resources. For instance, you may be most interested in making money, maintaining a visually pleasing area and keeping erosion to a minimum, thus you might weight the resource valuation cell as seen below.
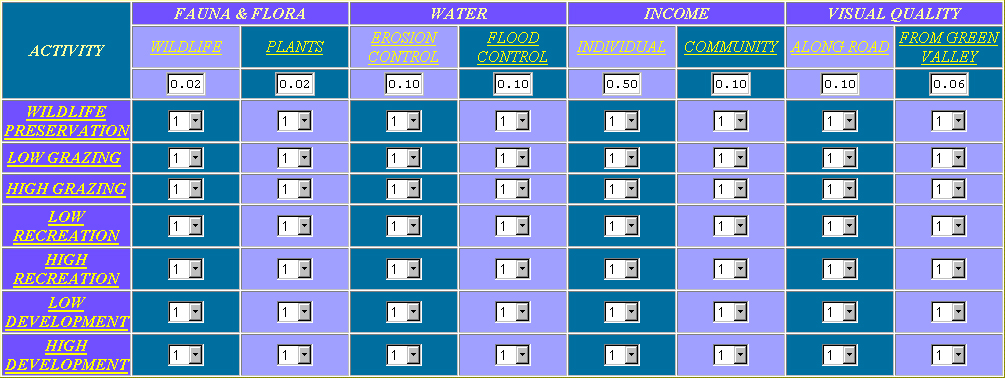
Notice that Individual Income is highly weighted, with the erosion and visual quality categories containing the next highest values (they all add to 1). This is merely a reflection of our own priorities (goals).Output:
Now that research has been done and the table has been filled out, click on the submit button. You will receive an output that looks like the following: (calculations).
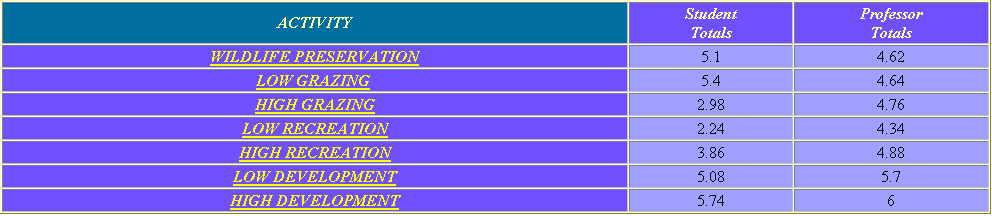
The first column of numbers is a numerical value ranking the desirability for each land use according to how the student filled in the "relative ranking cells". The second column used the average relative rankings of wildlife professionals in combination with the student inputted resource values. The higher numbers indicate the best land use according to the information that was entered into the single use matrix.
Back To Singleuse