Results
Irrigation Water
Of the irrigation water quality parameters measured, statistically significant differences were only found in total nitrogen (F2,31 = 30.413, p<0.0001). Total nitrogen levels in the negative control (100% well water taken from the shrimp farm supply line) averaged 20 mg/L N, 10 mg/L higher than the effluent water (t = 6.228, p<0.0001) and 12 mg/L higher then the irrigation ditch water (t = 7.096, p<0.0001). The 2 mg/L N difference between the effluent water and the irrigation ditch water was not statistically significant (t = 1.157, p = 0.2559). Levels of nitrate-nitrogen, total phosphorus, potassium and salinity were not statistically significant among the three water sources used in this research (p>0.05 for all parameters) (Table 2).
Table 2. Nutrient levels (means) of the water used to irrigate the experimental plot with the respective F-statistics and p-values. Numbers in parenthesis are the standard errors of the means.
|
Water Source |
|||||
|
Parameter |
Well |
Effluent |
Ditch |
F-Stat. |
p-Value |
|
Total Nitrogen (mg/L) |
20 (1) |
10 (1) |
9 (0) |
30.413 |
<0.0001 |
|
Nitrate-Nitrogen (mg/L) |
8.0 (1.6) |
8.3 (0.6) |
5.9 (0.6) |
1.5496 |
0.2274 |
|
Total Phosphorus (mg/L) |
0.52 (0.12) |
0.69 (0.05) |
0.59 (0.10) |
0.9114 |
0.4124 |
|
Potassium (mg/L) |
7.35 (0.97) |
6.51 (0.86) |
8.62 (0.21) |
1.9537 |
0.1578 |
|
Salinity (ppt) |
1.95 (0.30) |
1.38 (0.21) |
1.22 (0.20) |
2.5782 |
0.0911 |
Tree Growth
Height
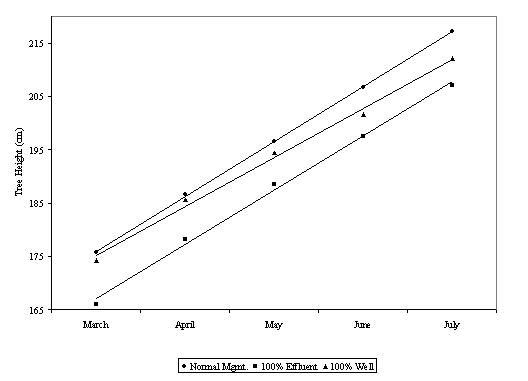
Tree height increased an average of 40.1 cm over the four month study period, from 172.1 to 212.2 cm (Fig. 4). Trees subjected to the normal farm management treatment grew 41.4 cm during the study and trees irrigated with 100% shrimp farm effluent water grew 41.1 cm during the study (Table 3). Trees irrigated with 100% well water grew 37.9 cm between March and July. Neither height differences nor the growth as measured by height was statistically significant among the three treatments investigated in this study (F2,109 = 1.3241, p = 0.2704 and F2,109 = 0.6438, p = 0.5273, respectively).
Figure 4. Monthly height of olive trees at Wood Brothers' farm in Gila Bend, AZ.

Table 3. Mean height and diameter of olive trees irrigated with various sources of water as measured between March and July 2001 at the Wood Brothers’ farm in Gila Bend, AZ.
|
Normal Mgmt. |
100% Effluent |
100% Well |
||||
|
Height |
Diameter |
Height |
Diameter |
Height |
Diameter |
|
|
March |
175.8 (4.6) |
1.93 (0.07) |
166.0 (3.7) |
1.65 (0.08) |
174.3 (3.9) |
1.85 (0.07) |
|
April |
186.6 (4.2) |
2.20 (0.08) |
178.3 (4.0) |
1.89 (0.09) |
185.6 (4.2) |
2.12 (0.08) |
|
May |
196.7 (3.8) |
2.49 (0.09) |
188.6 (3.8) |
2.18 (0.11) |
194.4 (4.4) |
2.35 (0.10) |
|
June |
206.7 (3.7) |
2.88 (0.10) |
197.5 (4.1) |
2.46 (0.12) |
201.6 (4.6) |
2.69 (0.12) |
|
July |
217.2 (3.6) |
3.08 (0.11) |
207.2 (4.1) |
2.59 (0.13) |
212.2 (5.0) |
2.95 (0.13) |
|
Growth |
41.4 |
1.1 |
41.1 |
0.9 |
37.9 |
1.1 |
Diameter
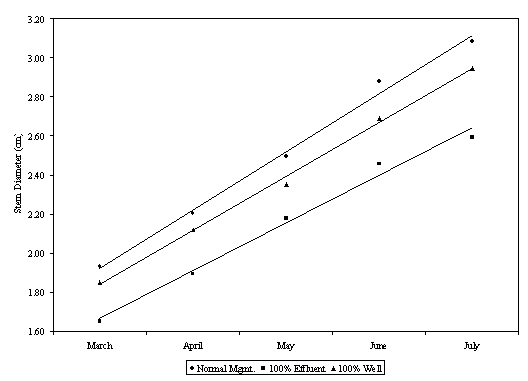
Stem diameter at 20 cm above ground increased by an average of 1.06 cm during the study period (Fig. 5). Differences in tree diameter were statistically significantly different among the three treatments (F2,109 = 3.7764, p = 0.0260) with trees in the effluent treatment having the smallest diameters, 2.15 cm versus 2.52 cm and 2.39 cm for trees in the normal farm management and negative control treatments, respectively (Table 3). However, the differences in growth as measured by tree diameter were not statistically significantly different (F2,109 = 2.5810, p = 0.0803) among the three treatments. Stem diameter growth averaged 1.15 cm per tree in the trees that were under normal farm management treatment, 0.94 cm per tree in the trees irrigated with 100% effluent water and 1.10 cm per tree in the negative control group.
Figure 5. Monthly measurements of olive tree diameter at 20 cm above ground.

Soil Salinity and Macronutrients
Soil Salinity
While soil salinity increased during the four month study period in all rows, the differences among the three treatments were not statistically significant (F2,11 = 0.6237, p = 0.5576). The greatest difference between soil salinity in March and July was seen in the 100% effluent treatment, where salinity increased by 1.99 ppt (Table 4). Soil salinity increased by 0.54 ppt in the 100% well water treatment and 0.37 ppt in the normal farm management treatment over this same time. None of the increases in soil salinity observed within each treatment were statistically significant (p>0.32 for all, from a two-sample t-test).
Soil Nitrate
Soil nitrate levels increased in the normal farm management and 100% effluent treatments, by 9.0 and 11.0 mg NO3-N/g dry soil, respectively from March to July (Table 4). Levels of soil nitrate in the negative control treatment rows decreased by 1.25 mg/g. None of the differences observed within treatments were statistically significant (p>0.31 for all, from a two-sample t-test). Differences among the three treatment groups were also not statistically significant (F2,11 = 0.5258, p = 0.6087).
Soil Phosphorus
Phosphorus levels in the soil decreased across all treatments from an average of 8.10 mg PO4/g dry soil in March to an average of 0.97 mg PO4/g dry soil in July (t = 1.792, p = 0.0868). The normal farm management treatment rows decreased by 0.15 mg PO4/g soil during the four month study. Decreases in soil phosphorus in the 100% effluent treatment and the 100% well water treatments were 9.08 and 12.18 mg/g, respectively (Table 4). None of the differences observed within treatments were statistically significant (p>0.21 for all, from a two-sample t-test). Differences in soil phosphorus decreases among treatments were not statistically significant (F2,11 = 0.7181, p = 0.5136).
Table 4. Changes in soil macronutrients and salinity from March 2001 to July 2001, as a result of irrigating with various sources of water. Numbers in parenthesis are the standard errors of the means.
|
Treatment |
|||||
|
Parameter |
Norm. Mgmt. |
100% Eff. |
100% Well |
F-Stat. |
p-Value |
|
Salinity (ppt) |
0.37 (0.95) |
1.99 (1.62) |
0.54 (0.54) |
0.6237 |
0.5576 |
|
Nitrate-Nitrogen (mg/g) |
9.0 (7.4) |
11.0 (13.0) |
-1.25 (4.9)* |
0.5258 |
0.6082 |
|
Total Phosphorus (mg/g) |
-0.15 (1.80)* |
-9.08 (8.40)* |
-12.18 (9.40)* |
0.7181 |
0.5136 |
|
* Negative number denotes a decrease between March and July. |
|||||