Every crop season presents a unique set of challenges. The cool spring of the 1998 season has already provided us with a special set of challenges including one of the latest starts in recent years. We also had approximately 30% of the acres in some parts of the state replanted this spring. The beginning of the season may impact this crop for some time. It will be absolutely critical to make as much from the first fruiting cycle as possible in an attempt to maximize the potential of the 1998 crop. Therefore, it is important at this stage to look ahead, anticipate several critical junctures in the season, and consider several management options.
In review of the cotton fruiting cycle, as shown in Figure 1, the period from the first pinhead square (PHS) to peak bloom (PB) represents the N application window for optimum crop utilization of fertilizer N. This portion of the fruiting cycle also represents the PRIME TIME for fruiting, where the primary, and often the most important phase of the fruiting cycle occurs. In terms of heat units accumulated after planting (HUAP), this period extends from about 700 HUAP to 2,000 HUAP. Growth stages can also be estimated by counting the nodes above the top (first position) white flower (NAWF) (Table 1). We still have an opportunity to realize a great deal of the potential offered by the 1998 cotton crop if this segment of the fruiting cycle is completed with a high level of fruit retention (FR) and strong crop vigor.
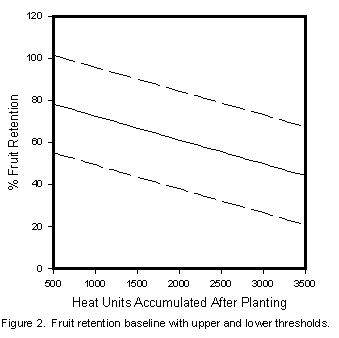
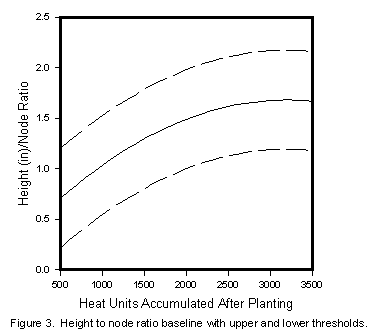
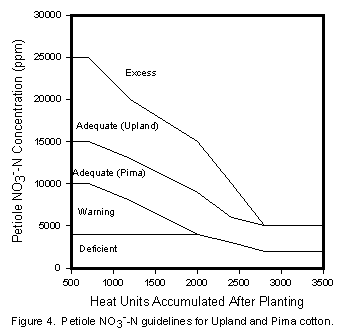
As the crop proceeds through the prime time period of development, the FR levels can be monitored and plotted against an established baseline for Arizona (Figure 2). Crop vigor can be estimated by use of a height to node ratio (HNR) and an established baseline for Arizona (Figure 3). Maintaining good plant-water relations and N fertility are very important aspects of crop management for both FR and crop vigor. A good irrigation management program should minimize/eliminate crop-water stress. In-season irrigations should be applied when crop-water use has depleted approximately 50% of the plant-available soil-water. Maintaining adequate N fertility in the crop will also be important. Efficient use of fertilizer N commonly involves utilizing split applications, consisting of about 50 lbs. N/acre between PHS and PB. Flexibility in N management is important and it should depend on any previous fertilization, crop FR and vigor (HNR), and the N fertility status of the crop (Figure 4).
With a late-planted crop it is common to expect increased vegetative growth and potential problems with excessive crop vigor. In cases where accelerated vegetative growth does occur, applications of plant growth regulators, such as PIXtm, may be appropriate. If HNRs are increasing substantially between sample dates, this is commonly the best time to make applications of materials like PIXtm. However, it is important not to make applications of materials such as PIXtm to crops that are experiencing low vigor conditions with HNR values at or below the middle baselines shown in Figure 3. Crops that are experiencing low vigor need growth stimulation to produce nodes, fruiting sites, and the capacity to hold and support squares and bolls (good water, N, and pest management).
Hopefully, the onset of monsoon conditions in Arizona will be late in 1998, allowing us a better opportunity to establish a strong fruit load in the developing crop. Without a doubt this crop is going to require some special attention, flexible management, and careful monitoring. For additional information regarding recommendations and guidelines concerning irrigation, fertilization, PIXtm management, and crop monitoring; readers can refer to appropriate bulletins available through the county offices of the University of Arizona Cooperative Extension System.
Table 1. Relationship between growth stage and nodes above top white flower (NAWF).
|
Gowth
Stage (HUAP)
|
NAWF
|
|---|---|
|
Early
Bloom (1200)
|
9-11
|
|
Peak
Bloom (~2000-2200)
|
7-8
|
|
Cut-out
(~2500-2800)
|
<5
|
Issued in furtherance of Cooperative Extension work, acts of May 8 and June 30, 1914, in cooperation with the U.S. Department of Agriculture, James A. Christenson, Director Cooperative Extension, College of Agriculture and Life Sciences, The University of Arizona.
The University of Arizona is an equal opportunity, affirmative action institution. The University does not discriminate on the basis of race, color, religion, sex, national origin, age, disability, veteran status, or sexual orientation in its programs and activities.
Any products, services, or organizations that are
mentioned, shown, or indirectly implied in this web document do not imply
endorsement by The University of Arizona.
Information provided by Jeffrey C. Silvertooth, silver@ag.arizona.edu
Extension Agronomist - Cotton, College of Agriculture, The University of Arizona.
Material written 22 May 1998.
Home | Cotton | Advisories
document located at: http://cals.arizona.edu/crops/cotton/comments/may1998cc.html
Copyright © 2001 University of Arizona,
College of Agriculture and Life Sciences
Webmaster: Al Fournier (acis@ag.arizona.edu)


