Soil management for drylands
![]() ALN No. 58, Winter 2005
ALN No. 58, Winter 2005
Soil management for drylands
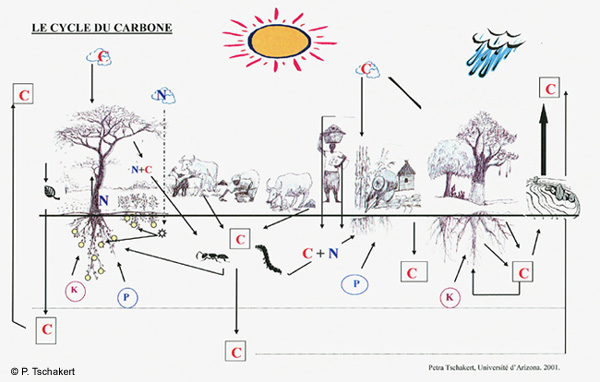 |
| This diagram of the carbon (C) and nitrogen (N) cycles (with representation of potassium (K) and phosphorus (P) as well) was used in training workshops during the project and built on farmers' conceptual, empirical understanding of soil fertility and degradation. |