Figure 1 (Click the figure to see enlarged picture)
|
Data and background: Pink Bollworm (PBW) is an important pest
on cotton both in Pakistan and the United States(see
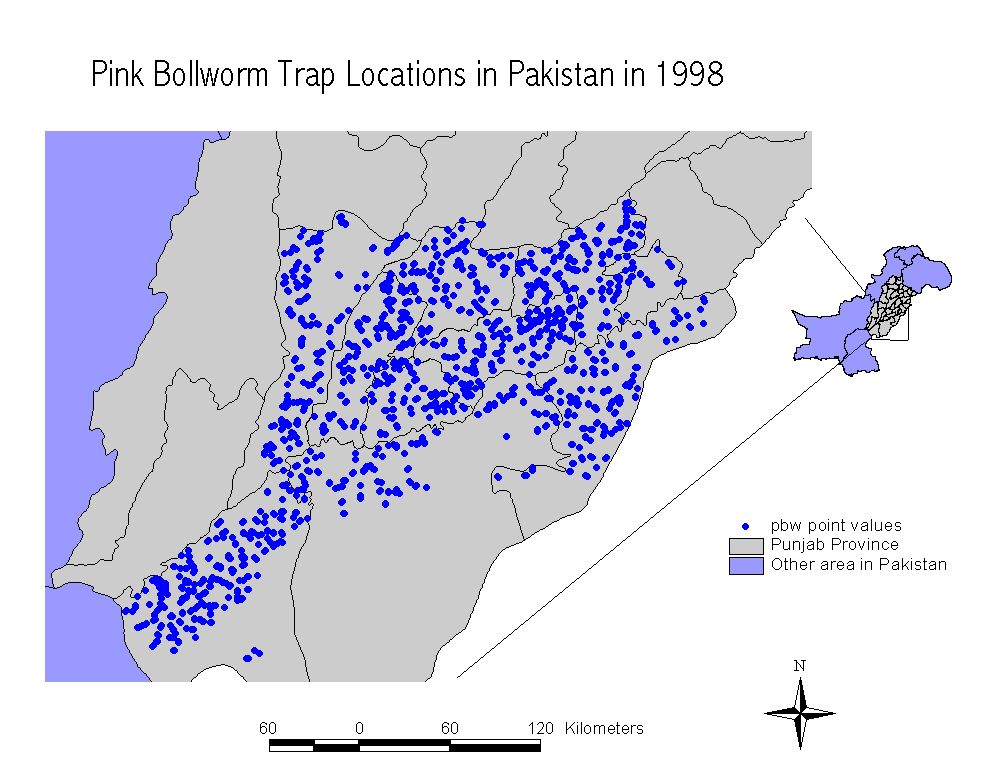
web reference). PBW population data were collected by the Central Cotton
Research Institute (CCRI) from over 1000 locations in Punjab province in
Pakistan between June 8 and Oct 26,1998. The population data are based
on moths counted in sex pheromone traps weekly. Data are expressed as moth
catches per trap per night. The time span covers most of the growing season
of cotton in Pakistan. The sample locations are shown in figure
1. The data were analyzed in the Department of Plant Pathology in the
University of Arizona using Geostastistics
and GIS. We are trying to find the temporal and spatial patterns of
pest and disease epidemics, which can be consulted as part of a pest management
program. The temporal and spatial patterns are shown below.
Results and analysis:

Figure 2(click the figure to see details of analysis)
|
Temporal patterns.The PBW population is very low at the beginning
of the season in most of the sampled area. Figure
2 show the results from each district. In figure 2 we can see the trend
of PBW population during the season in all of districts where samples were
taken : 1) The PBW populations increase progressively from June 8th to
around July 27th; 2) They come to a peak between July 20th and Aug 3rd;
3)The populations level off or decline ofter Aug 3rd. Trap counts are relatively
high until the end of the season. In some of the districts, the values
have a slight increase after Oct 12th (For example, the Sahiwal, Rannanpur
and Layyah districts).
The temporal patterns can also can be seen in the suface maps (Figure
3).

Figure 3(click the figure to see details)
|
Spatial patterns. The PBW population was mapped using the method
of indicator kriging
(Figure 3). The PBW population is consistently high during the season
in several areas(Area 1,3,4,5,7,8,11). At the beginning of the season,
high populations were limited to within the Khanewal district. Then they
moved and expanded very fast around July 13th. The eastern and northern
areas had the highest population of PBW over the whole season. There was
a dramatic increase of PBW population in area 3,4,7 and their surrounding
area at the end of season.

Figure 4(click the fiugre to see details)
|
The locations with very high populations of PBW are shown in figure
4 .The figure shows the probability that trap counts will exceed a
high threshold. The threshold selected is 3.4 moth catches/trap/night (which
is 75% quantile of the July 27th data). This threshold is slightly below
the 4 to 5 moths/trap/night used to warn farms to be vigilant about pest
infestation in their fields. From Figure 4, we can see that fields in areas
1,3,4,7 and 10 had a high probability of being above the 3.4 threshold
around July27.
Back to Pakistan Project