Spatial analysis of Cotton Leaf Curl
Virus in Mian Channun 1998.
 Figure 1 (Click the figure to see enlarged picture)
|
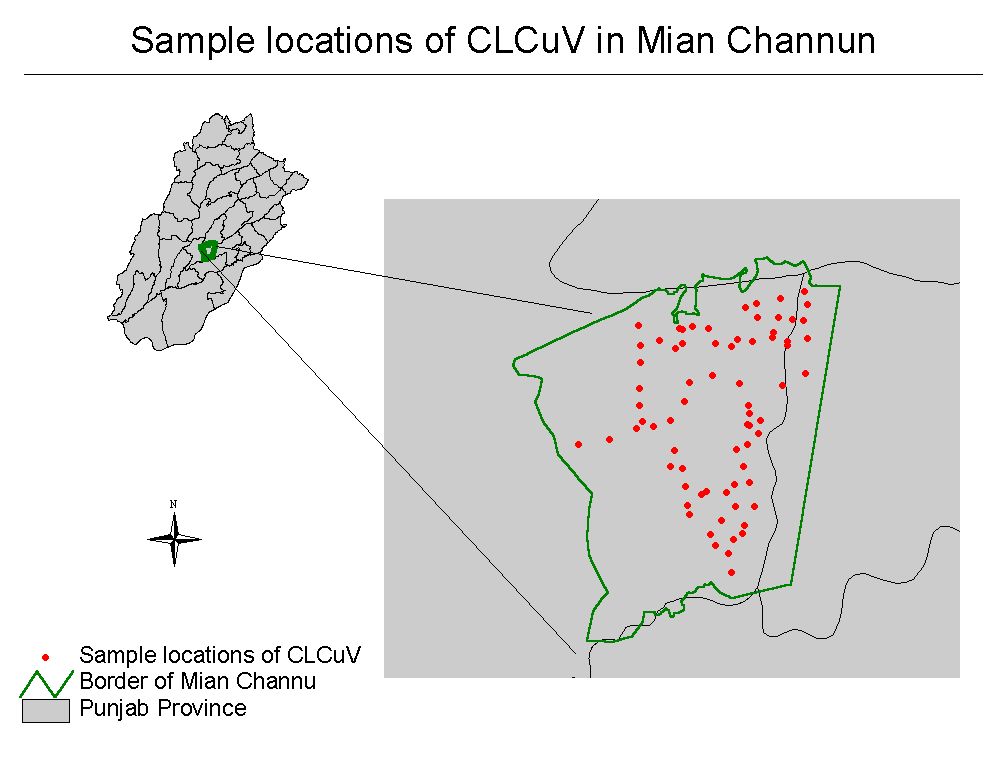
Data and background: The Cotton Leaf Curl Virus (CLCuV) is a ssDNA
virus belonging to Geminiviridae (Reference 1 and
2). It can cause severe yield reduction in infected plants. Characteristic
symptoms include such as upward or downward curling of leaves, vein distortion
and thickening, and enations on the underside of the leaves(Reference
1 and 2). Virus epidemics has been observed in the cotton-growing area
of Punjab Pakistan since 1991. Since 1996 the research group of Dr. Athar
Nadeem at the Central Cotton Research Institute (CCRI) in Pakistan has
collected CLCuV incidence data in Mian Channun in Punjab Province (Sample
locations see Figure 1). The incidence of
CLCuV is scored on a scale from 0-4 (0: no virus symptom, 4: the most severe).
The data in 1998 were collected in May, July, August and October (once
per month). The susceptible varieties of cotton were selected and their
virus incidences were analyzed using Geostatistics
and GIS. The surface maps are shown below. The comparison of spatial
patterns between 1997 and 1998 will be discussed. Based on the previous
research in the lab (Reference 3). the possible relationship
between the virus epidemics and the landscape properties will also be discussed.
Results and analysis:
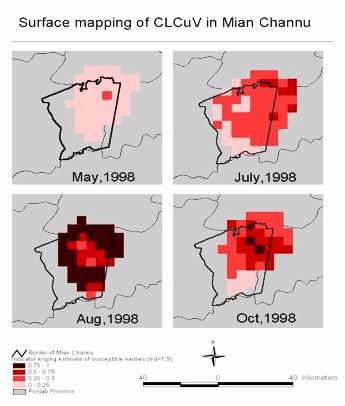 Figure 2(click the figure to see enlarged picture)
|
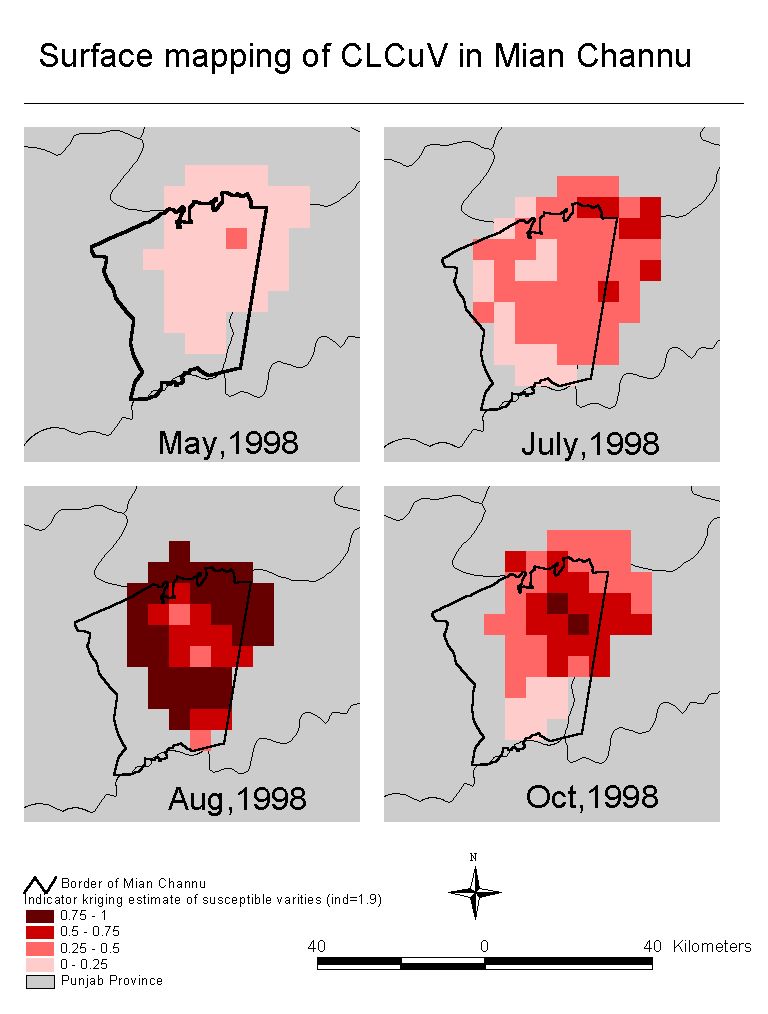
Spatial patterns of susceptible varieties: The incidence of CLCuV
on susceptible varieties of cotton varied from the beginning to the end
of the growing season. It is appropriate to use a geostatistic analysis
to find out the spatial patterns of CLCuV incidence. The kriging estimates
in the surface maps (Figure 2) represent the
probability a field will have an incidence of 2 or greater. From the surface
maps, we can see that the incidence of CLCuV is very low in May and July.
In August, incidence increased dramatically, especially in the north, northeast,
south and southwest of Mian Channun. In most of the growing area in August,
the incidence was high. However, in October CLCuV incidence in the northeastern
area kept high while in the rest area it came to very low level.Incidence
in October was difficult to assess because of insect damage. So we have
less confidence in these data. Because of the limited size of the data
set, the error of kriging estimate is relativley high in the area where
there are few observation points.
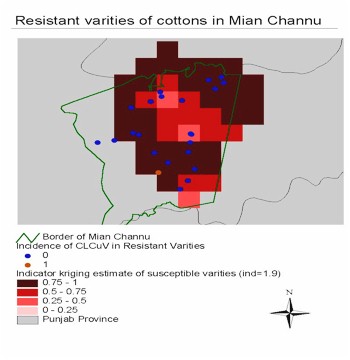 Figure 3(click the figure to see enlarged picture)
|
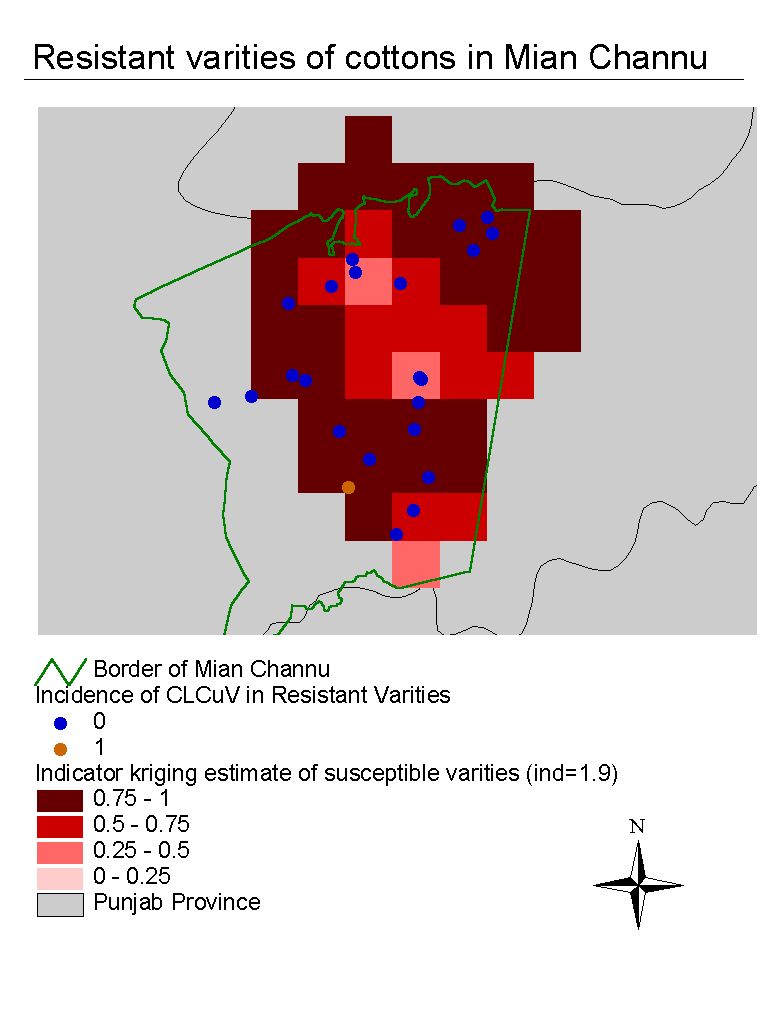
Resistant varieties. The CLCuV incidence on some varieties of cotton
was as low as zero throughout the season, even when the virus incidence
on other varieties was very high. Those cotton varieties are CIM435, CIM443,
CIM446, CIM448 and CIM1100. We display the field location of resistant
varieties as points in a surface map of virus incidence on susceptible
varieties in August (see Figure 3). The
figure shows that the low virus incidence in fields with those varieties
occurred in areas with high risk of CLCuV based on the susceptible varieties.
Discussion:(to be continued)
Reference:
-
Nadeem
A1, Weng Z, Nelson MR, Xiong Z ,1997. Cotton leaf crumple virus and cotton
leaf curl virus are two distantly related geminiviruses.Molecular Plant
Pathology on-line.
-
Hameed S, Khalid S, Ehsan-Ul-Haq, Hashrni AA, 1994. Cotton leaf curl disease
in Pakistan caused by a whitefly transmitted geminivirus. Plant Disease
78, 529.
-
Nelson,M.R., Orum, T.V., Jaime-Garcia, R., Nadeem, A.,
1999, Application of Geographic Information Systems and Geostatistics in
Plant Disease Epeidemiology and Management. Plant Disease 83:308-319
Go to the top
Back to Pakistan Project
Presented by Lihua
Cao, Research Assistant in Department of Plant Pathology, UA
|