Expansion and Contraction of the
Sahara Desert

Fluctuation in the size of the Sahara Desert (bar), 1980 - 1990, showing (a) the percentage change relative to 1980 area (red line), and (b) percentage mean annual precipitation departures (blue line). A linear, inverse relationship (r2 = 0.78, n = 11) between rainfall and expansion/contraction of the desert's southern margin is clearly evident.

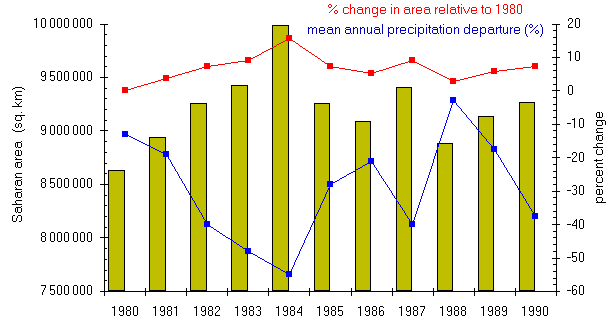
Data sources: Tucker, C.J., H.E. Dregne, and W.W. Newcomb, 1991. Expansion and contraction of the Sahara Desert from 1980 to 1990. Science 253, 299-301; Hulme, M. and M. Kelly, 1993. Exploring the links between desertification and climate change. Environment 35:6, 5-11, 39-45.


The correct citation for this chart is:
Milich, L., 1997. Expansion and contraction of the Sahara desert. http://ag.arizona.edu/~lmilich/bound.html.


Back to Deserts of the World

This site last updated June 14, 1997.