UNDER CONSTRUCTION!!!
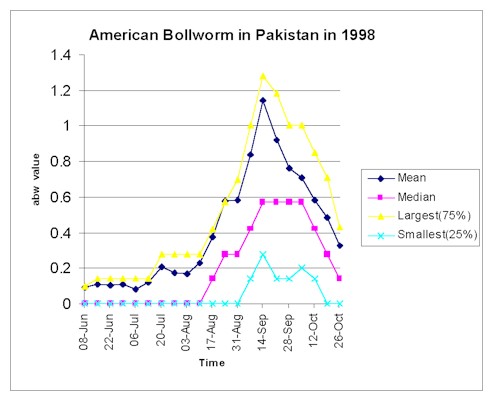
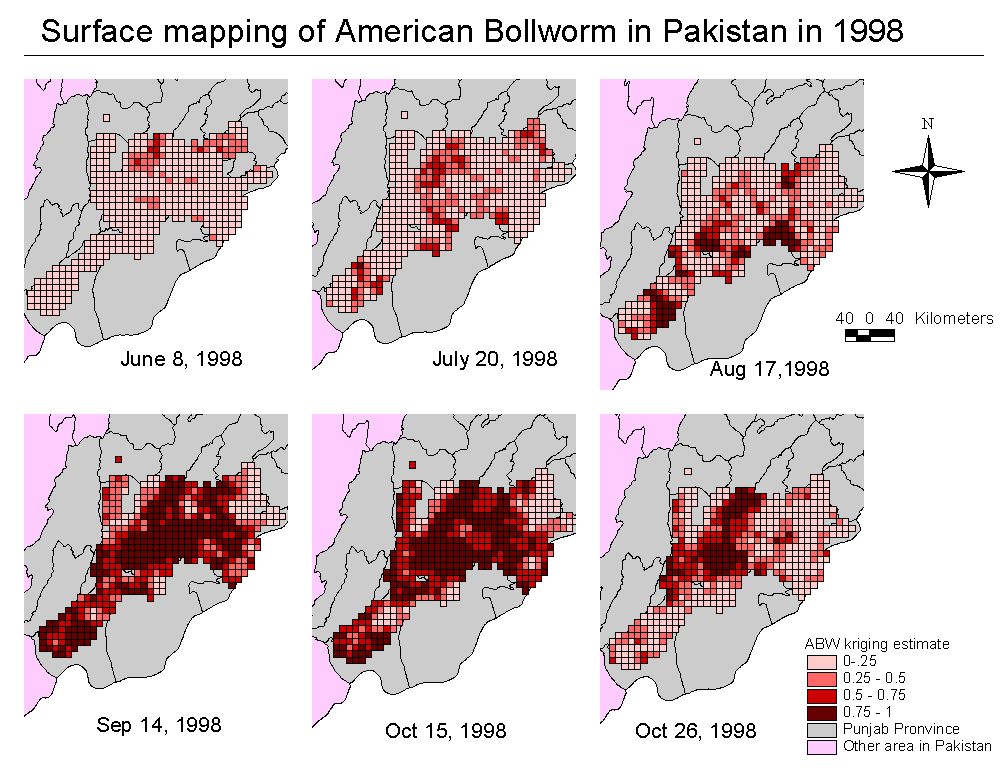
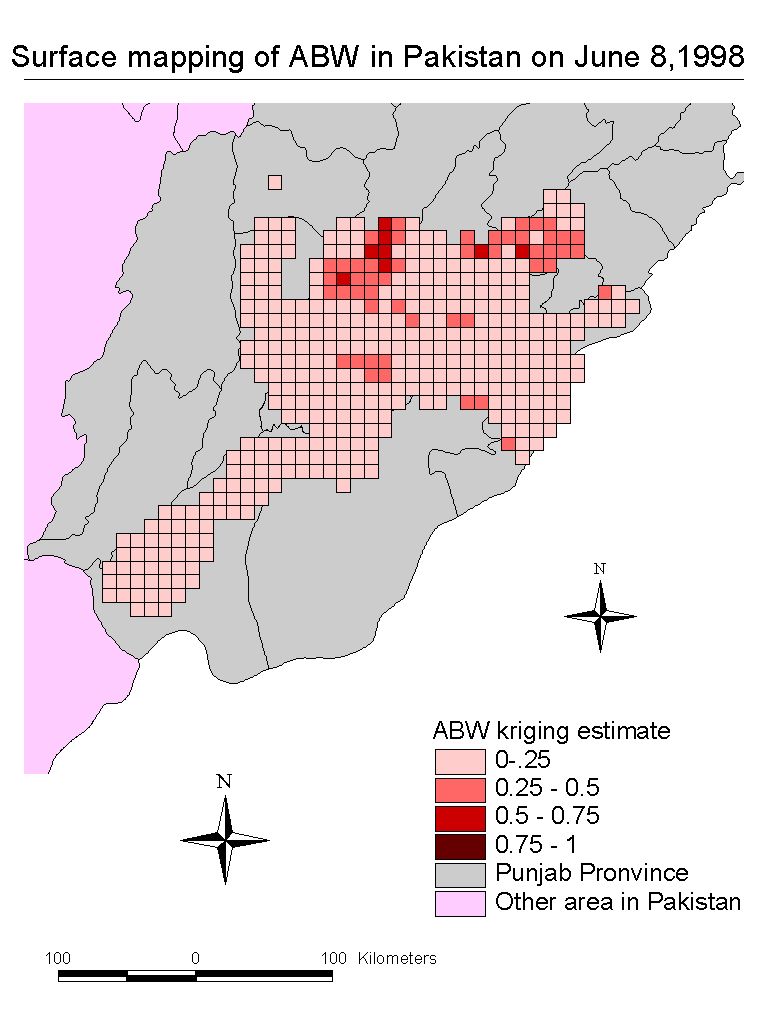
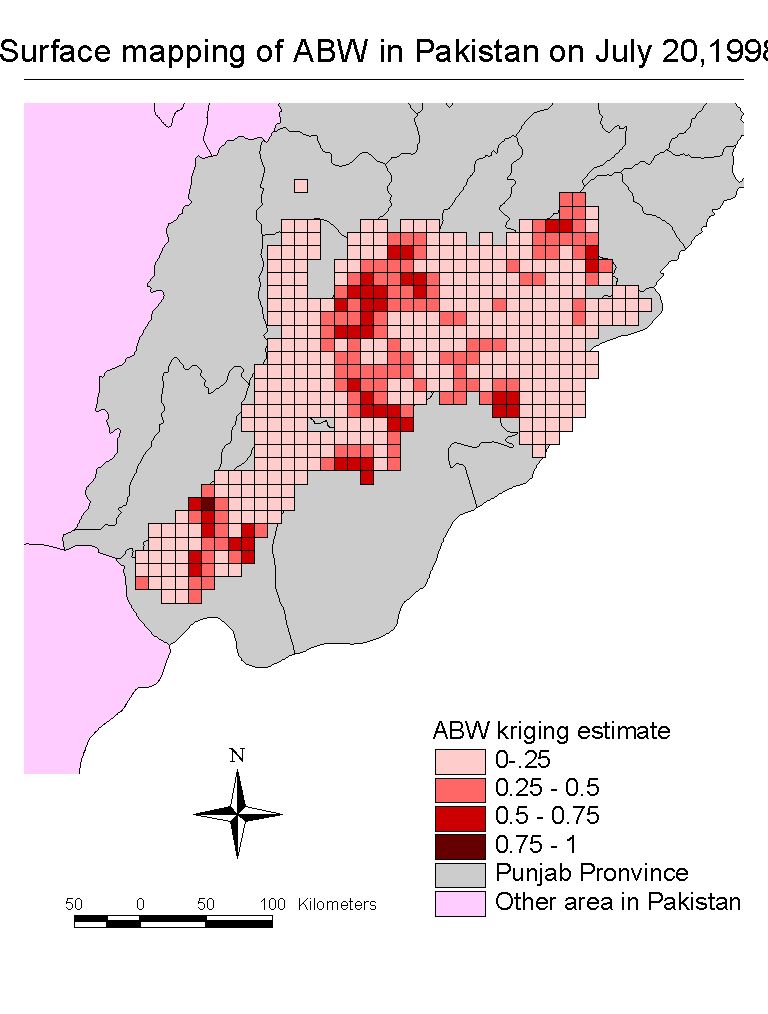
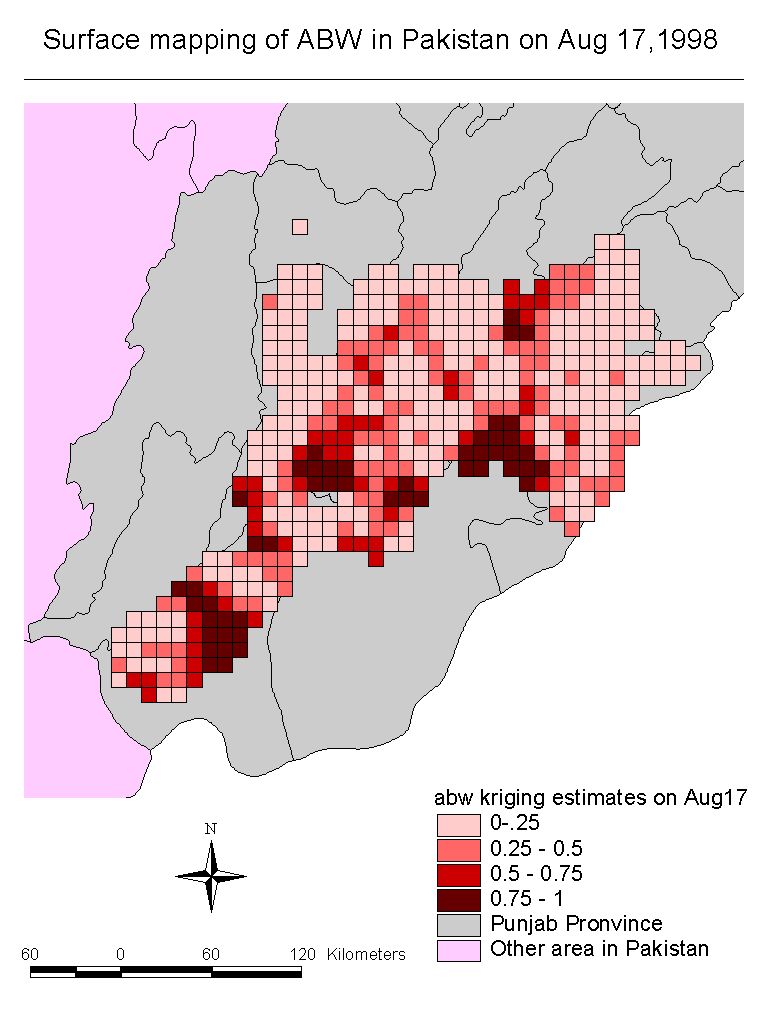
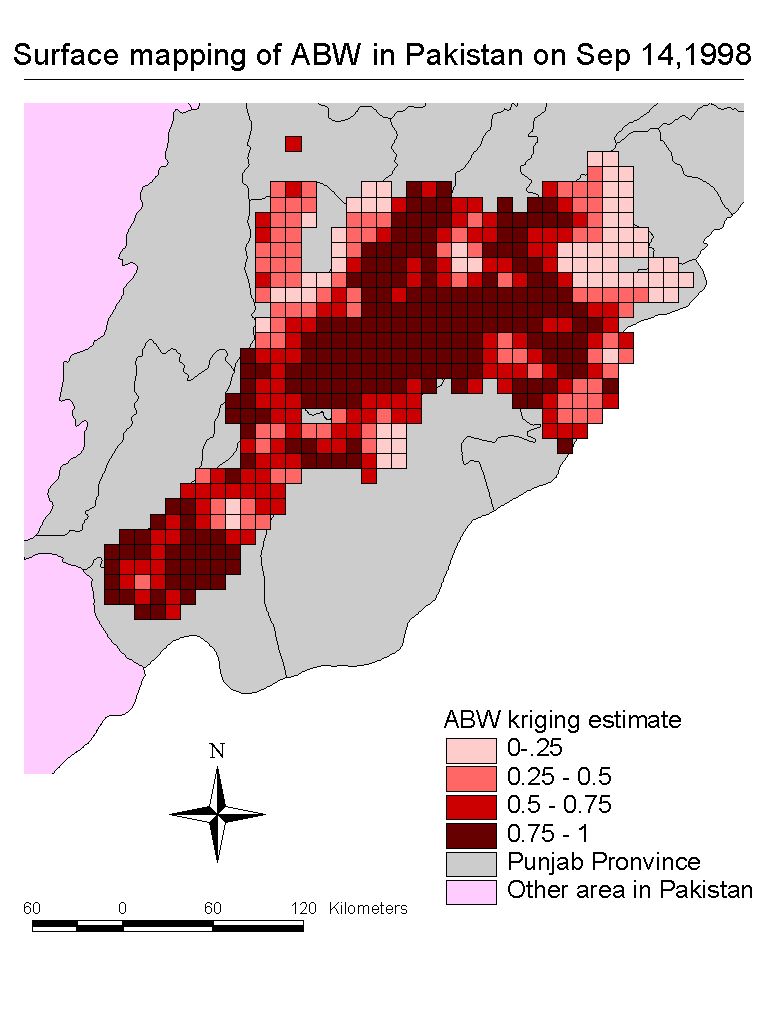
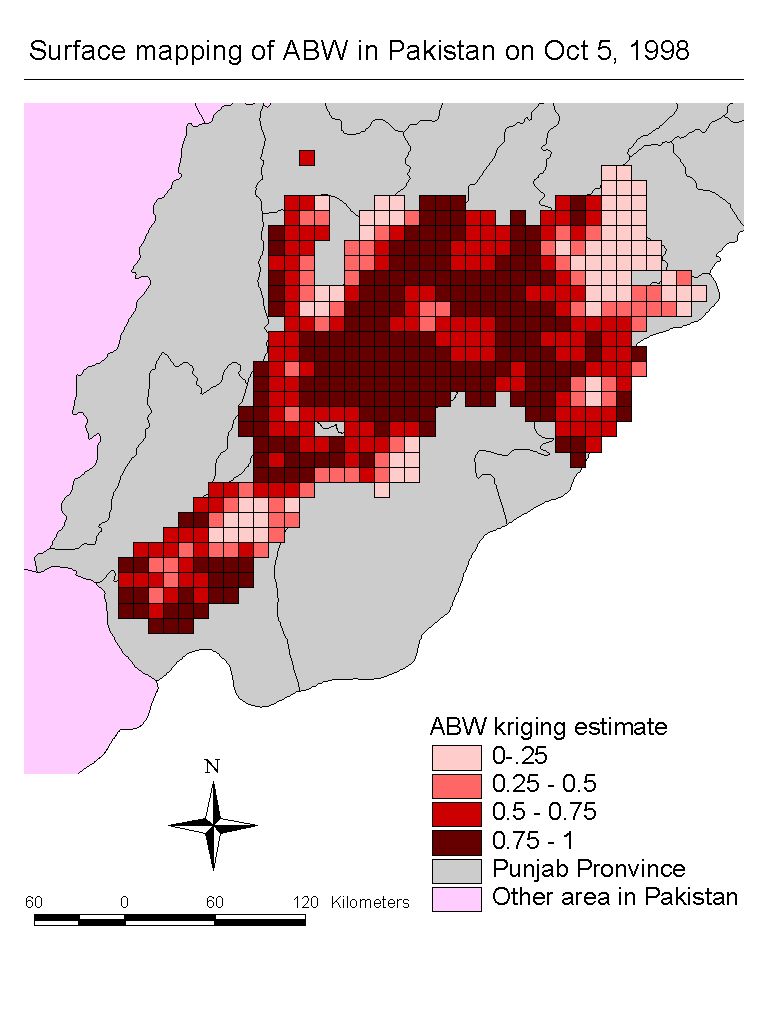
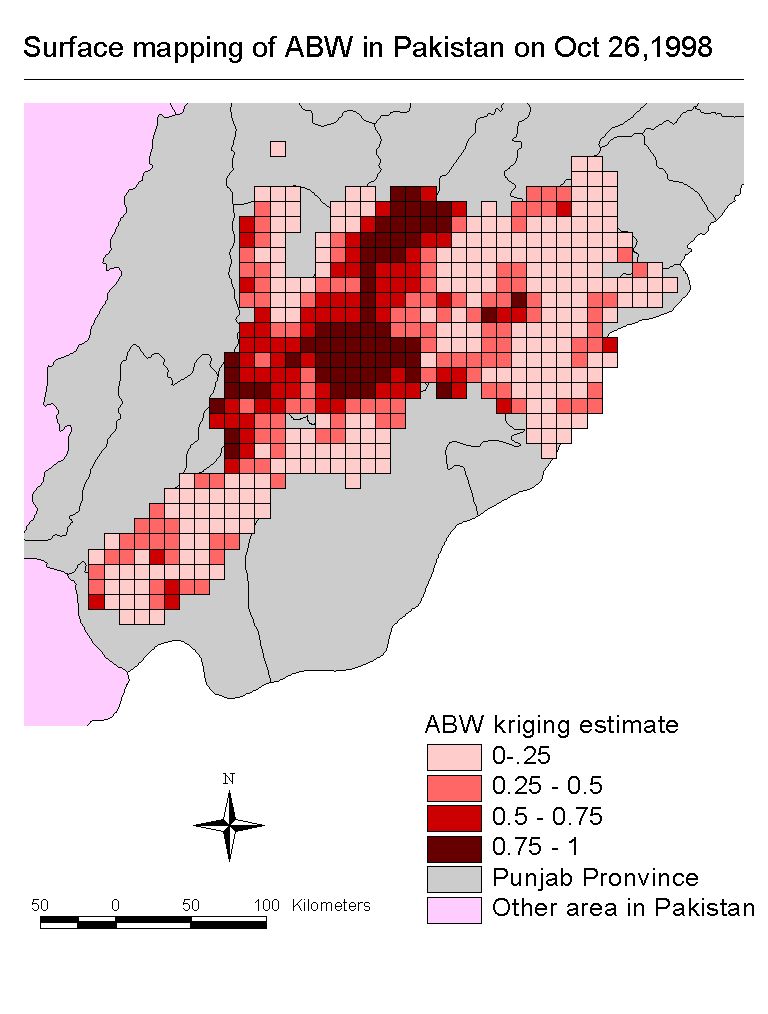
Spatial and temporal patterns of American Bollworm population in Pakistan in 1998.
|
|
U of A Plant Pathology HOME | U of A Plant Pathology GIS Home | U of A GIS User Group |
UNDER CONSTRUCTION!!!
Spatial and temporal patterns of American Bollworm population in Pakistan in 1998.
|
|
U of A Plant Pathology HOME | U of A Plant Pathology GIS Home | U of A GIS User Group |
Contact: Tom Orum at torum@ag.arizona.edu Merritt Nelson at mrnelson@ag.arizona.edu 4/13/99 http://ag.arizona.edu/PLP/GIS