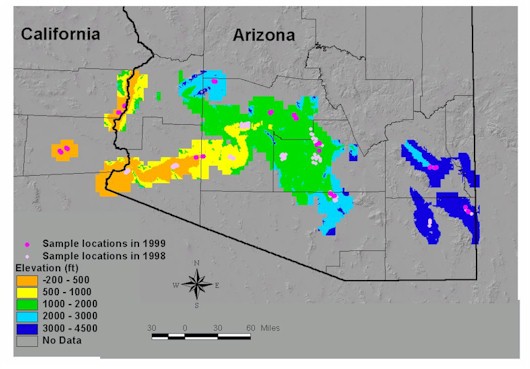
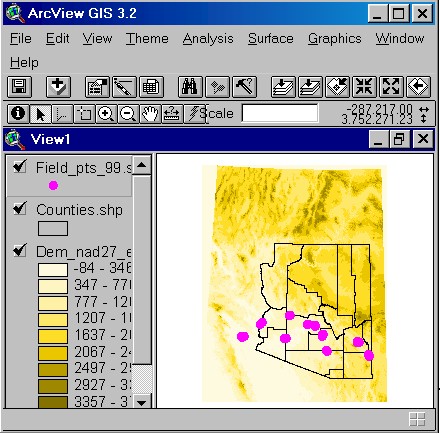
DEM stands for Digital Elevation Model. DEM's are grids (numerical arrays) in which the grid cells contain the elevation of that cell. DEM's are available from a number of sources including the USGS. The resolultions of the DEM depends on the size of the grid cell. Grids are a special kind of GIS format. In order to view and manipulate grid cells in ArcView, a Spatial Analyst extension to ArcView needs to be acquired and installed along with ArcView. Once Spatial Analyst is installed on the computer, you need to add the extension to the ArcView project. The Spatial Analyst extension allows you to manipulate the DEM with shapefiles to combine the elevation information with other spatially referenced information such as Aspergillus flavus S strain incidence. Here is an example of a DEM for southern Arizona:
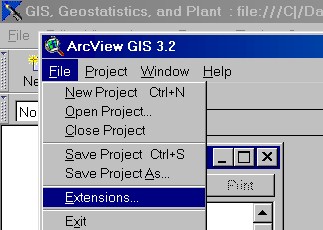
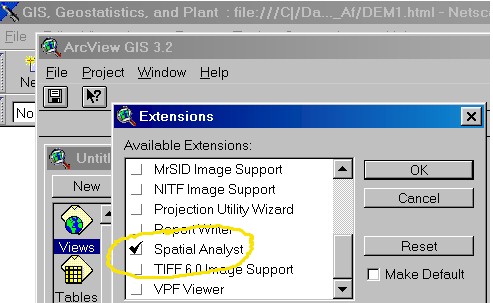
First, open ArcView and add the Spatial Analyst extension:
Then,
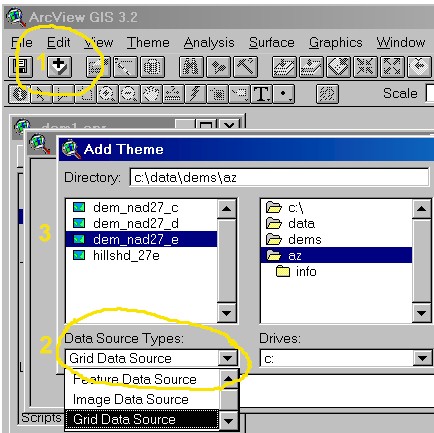
After you have added the spatial analyst extension, open a new view and see below: 1. press the "Add theme" button.
Then add the sample point data and the county polygon data. For these be sure the Data Source Type is designated as Feature Data Source.
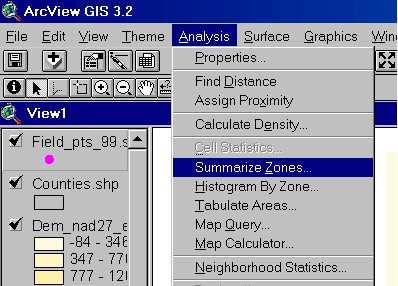
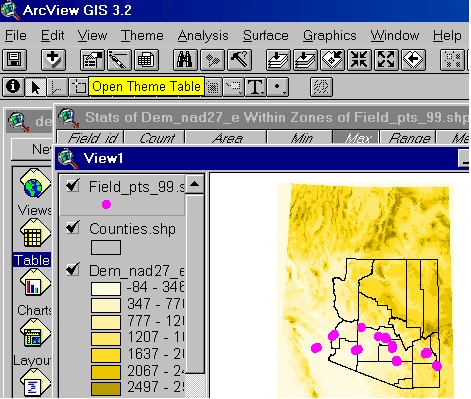
With the Field_pts_99 theme highlighted as shown above, select "Summarize Zones" from the Analysis drop down menu,
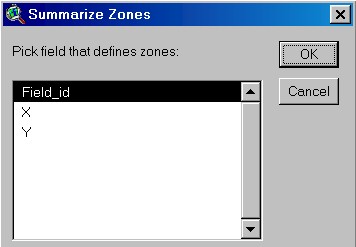
and select Field_id as the field that defines zones:
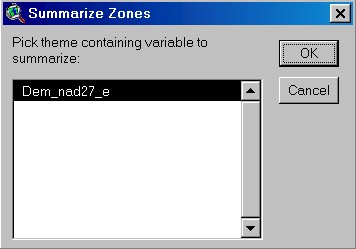
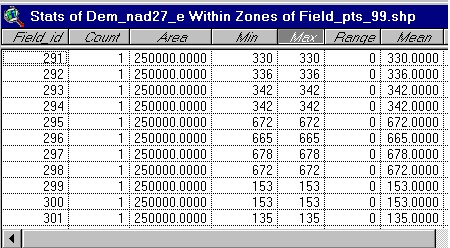
Select the desired DEM as the theme containing the variable to summarize:
For every point, the elevation value for the grid cell containing the point is recorded in a Stats table. Because it is a point theme, the Min, Max and Mean are all the same for a given point. If a polygon theme were selected to summarize by zone, there might be many grid cells in a polygon and thus the max and min could differ.
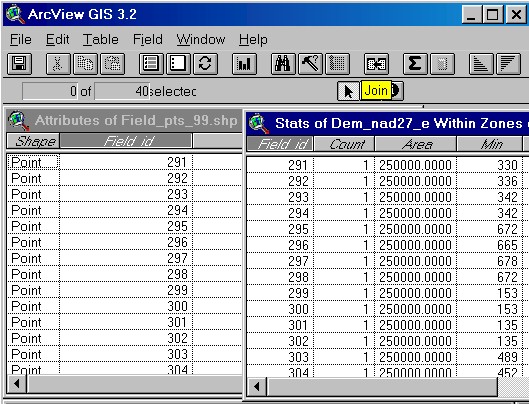
Next move to View 1 and Open the Theme Table for the points theme.
With the Field_ID columns highlighted use the "join" icon to join the Stats of Dem table with the Attributes of Field_pts table.
The result is both the S strain incidence and
elevation information in the same table. From that table a scatterplot
of elevation and S strain incidence can be constructed in a variety of
programs such as MS Excel:
Return to opening menu for case study.
|
|
U of A Geostatistics | U of A Plant Pathology GIS Home | U of A GIS |